


S&P 500, EURUSD, AUDUSD Points:
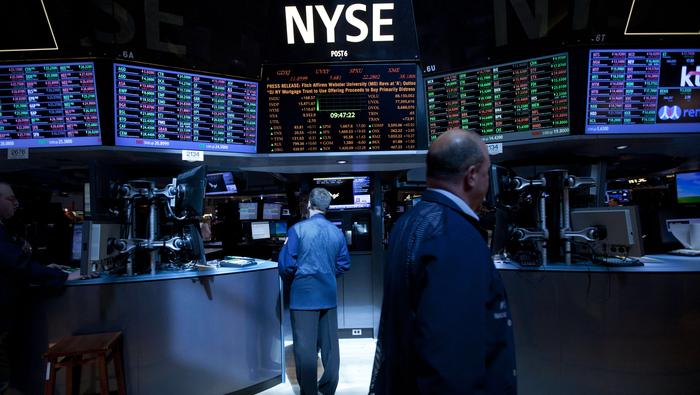
- US payrolls for the month of June absolutely trounced expectations with a 4.8 million net increase in job, yet risk appetite notably flagged after the update
- Liquidity is a key factor through the final session of the week and the principal medium to look forward to into next week
- The most prominent fundamental drivers to market ahead are the concerns around the spread of coronavirus with its knock on effects for recession and trade disputes, but mind amplified assets like AUDUSD
Resiliency that Works Both Ways – Risk Appetite Fails to Capitalize on NFPs
Over the past months, the markets have shown a remarkable amount of resilience in the face of troubling fundamental uncertainty. Despite frequent reminders of an unprecedented recession and its many knock on consequences, benchmarks like the S&P 500 and Nasdaq 100 continued their climb unimpeded. Such a bullish bias in risk appetite would insinuate a backdrop whereby detrimental event risk was readily overlooked and favorable updates were amplified. And yet, the data run on Thursday was topped by an extraordinary increase in US nonfarm payrolls (NFPs) that would readily satisfy speculative appetites; but the advance notably dried up in the face of support.
| Change in | Longs | Shorts | OI |
| Daily | -1% | -4% | -3% |
| Weekly | -3% | -6% | -5% |
Chart of the S&P 500 with 50-Day and 200-Day Moving Averages (Daily Chart)
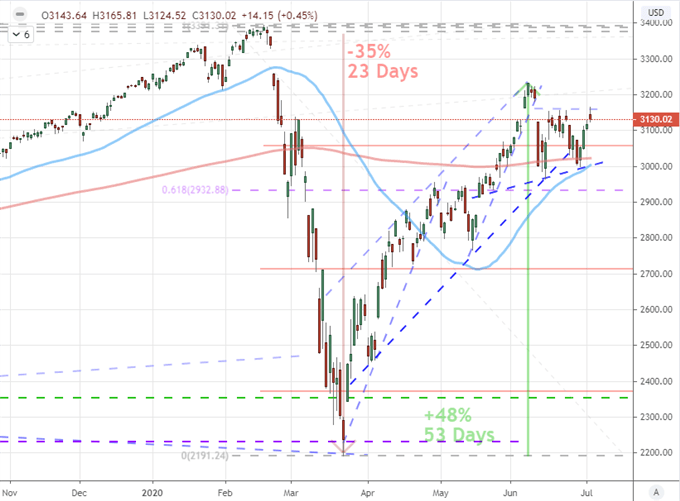
Chart Created on Tradingview Platform
One of the most disruptive features of the market landscape through Thursday was the drain on liquidity. This can work both for and against prevailing trends. Volume behind US equities, as a proxy for the global markets, dropped sharply through the past session despite the fireworks on the headlines. It is a tall task to commit to a systemically important bearing whether it conform with the prevailing bearing or attempt to reverse that course. For the S&P 500, breaking 3,150/160 would prove too risky even for a crowd that has a propensity to through caution to the wind. Through Friday’s session, the thinned market conditions can certainly amplify surprise and volatility; but trend development is something for which we should remain skeptical.

Chart of the Nasdaq to S&P 500 Ratio Overlaid with the S&P 500 to VEU in Green (Daily Chart)
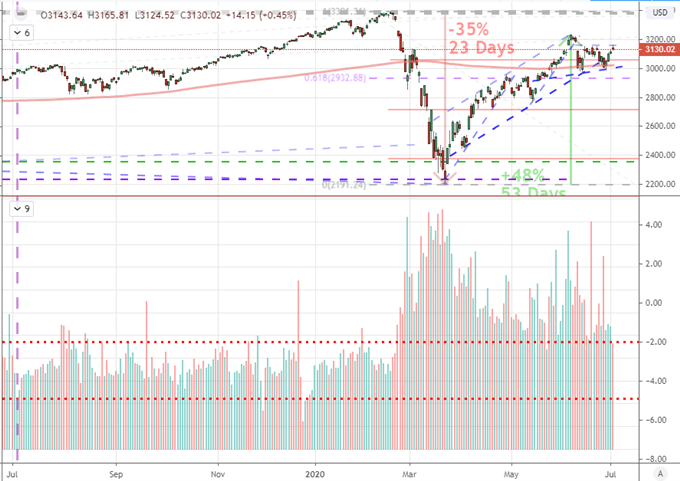
Chart Created on Tradingview Platform
A Forward Looking Bias in Fundamentals and Markets
For those keeping track, this past session’s lack of lift in speculative benchmarks was particularly extraordinary given the propensity around favoring bullish event risk. Yet, I believe the ultimate market outcome wasn’t too far off the mark for what we should expect from a risk rank that carries a forward looking bias. For the June NFPs, there is little dispute that the 4.8 million jobs added to the payrolls was extraordinary – it was a modern day record – but the context is nevertheless humbling as there are 14.7 million fewer jobs from the peak employment number just a few months ago.
Chart of Total US Payrolls in United States (Monthly)
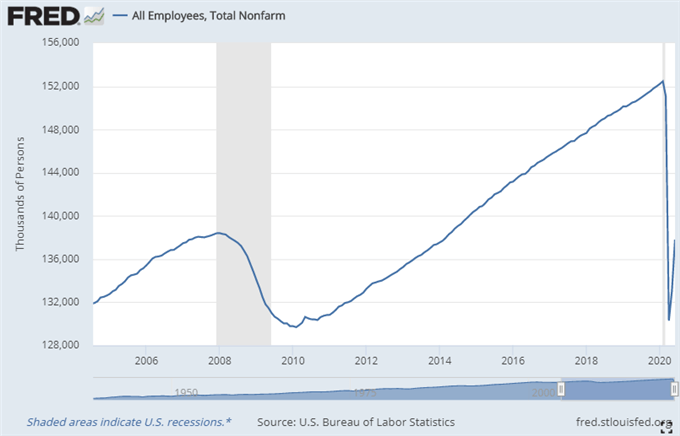
Chart from Federal Reserve Economic Database
Looking at further supporting employment statistics, the jobless rate percentage was still extraordinarily high at 11.1 percent, average hourly earnings dropped -1.2 percent and initial jobless claims through this past week tallied a greater number than expected. That ‘V-shaped’ recovery still looks like a very impractical course even if markets suggest a crowd that wants to believe it is possible.
Twitter Poll on the Path of US Recovery
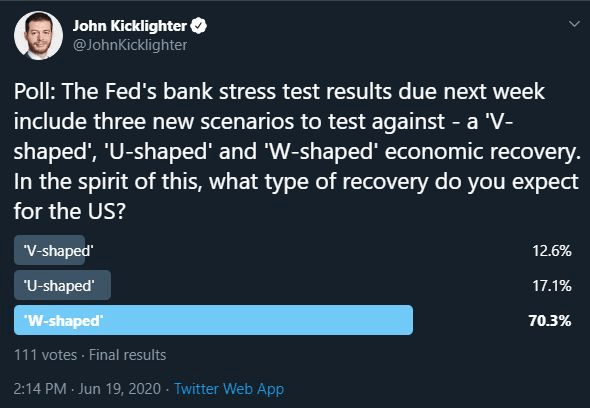
Poll from Twitter.com, @JohnKicklighter
Markets are naturally directed by the forward looking nature of speculative appetitive. Many traders and investors base their decisions not on all the information that is currently available, but rather what they expect the course to reflect heading forward. That necessarily forces an emphasis on systemic themes that will alter expectations for potential ahead. That is perhaps why the data an forecasts that have warned of intense recession these past weeks have been downplayed in favor of favorable views just a little further beyond the event horizon. Yet, this is not always a favorable matter. Against tangible evidence of a strong jobs figure, we have a fresh record high in cases of coronavirus infections in the United States along with the accompanying economic fallout that would imply.
Graph of US Cases of Coronavirus (Daily)
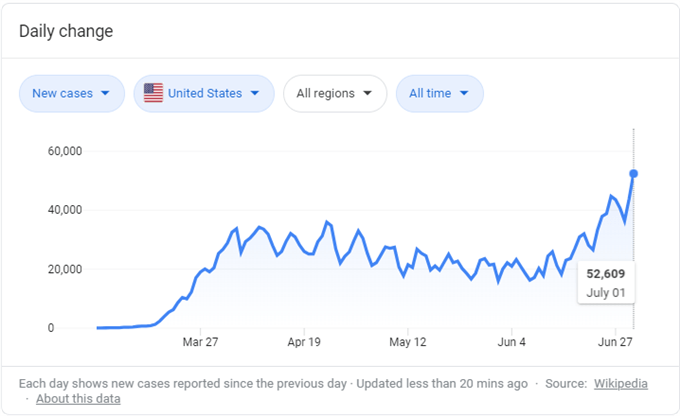
Chart from Google with Data from Wikipedia
Breakout Candidates and the Most Loaded Markets
Looking ahead, there is potential for markets to move. Through the final trading session of the week, most regional capital markets are opened for Friday and the FX market will carry on despite the absence of US exchanges. Nevertheless, I am dubious that there will be the capacity to forge a serious trend with momentum. Weighing this situation, EURUSD will be a candidate worth assessing. The benchmark pair has worked its way into a narrowing wedge and volatility could very well find amplification in shallow liquidity. Yet, fueling a lasting break looks particularly unlikely. Next week may be a different case for market conditions, but my interest will still hold to the systemic.
| Change in | Longs | Shorts | OI |
| Daily | -4% | 2% | -1% |
| Weekly | -14% | 21% | -1% |
Chart of EURUSD with 15-Day Historical Range as Percentage of Spot (Daily)
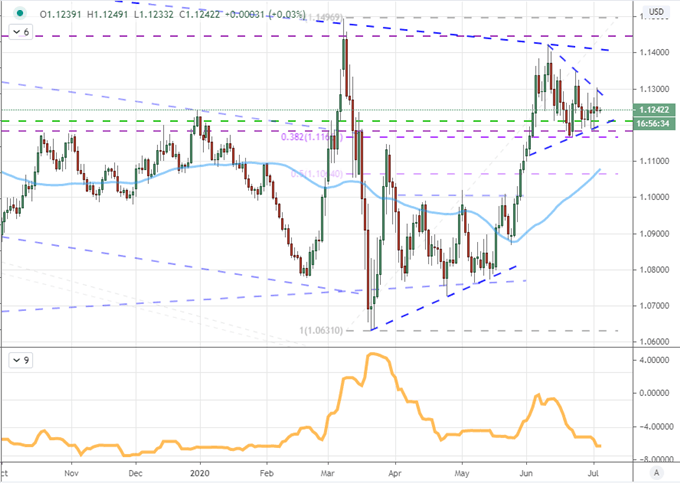
Chart Created on Tradingview Platform
For themes, I am still particularly mindful of the resurgence of the pandemic. The implications for the economic recovery, trade wars and scrutiny over insipid monetary policy are serious. On that note, event risk that stirs the attention around these more elemental matters will present greater weight. That said, I won’t ignore event risk that hosts a more discreet influence. AUDUSD for example is a pair to watch closely with event risk such as the RBA rate decision, service sector activity and retail sales.
| Change in | Longs | Shorts | OI |
| Daily | 2% | 2% | 2% |
| Weekly | -23% | 52% | -7% |
Chart of AUDUSD with 50-day Moving Average and COT Net Speculative Futures Positioning (Daily)
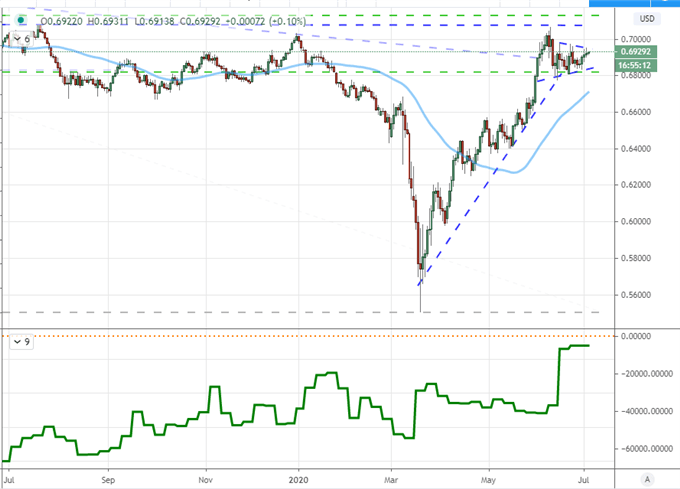
Chart Created on Tradingview Platform

If you want to download my Manic-Crisis calendar, you can find the updated file here.
.


