


Dow, S&P 500, EURUSD Talking Points:
- The Dow posted its biggest bullish gap higher Tuesday since April 7th, but follow through was notably lacking on this and other risk benchmark
- On the bullish side of the scale, follow through on the Fed’s bond purchase expansion warmed bulls more than Powell’s remarks, but a $1 trillion infrastructure program has charged
- Alternatively, reports that Beijing was shutting down on schools to halt a spread of COVID cases exacerbated news that certain US states were recording rising hospitalizations
Risk Assets Gap Higher and Stall
There was an unmistakable appetite for higher return and higher risk assets this past session – at least through part of the session, which can at least explain the presence of gaps for some of the benchmarks I monitor most closely. Against a backdrop of further stimulus measures from the world’s biggest players, a speculative bid wouldn’t exactly come as a bolt out of the blue. Yet, with the persistent reminders of recession and a worrying rise in pandemic case headlines, momentum is perhaps the least reliable aspect of our broader market. That inconsistency was on full display through the US indices. For example, the Dow posted its biggest bullish gap on the open since April 7th but Tuesday’s ultimate doji candle showed an underwhelmed market. Perhaps the proximity to the 200-day moving average, attempts to ‘close the window’ on the previous gap and any struggle relative to successively lower highs will draw greater attention to the systemic struggle.
| Change in | Longs | Shorts | OI |
| Daily | -1% | -7% | -4% |
| Weekly | 16% | -10% | 1% |
Chart of the Dow Index with 200 Moving Average and Daily Gaps (Daily Chart)
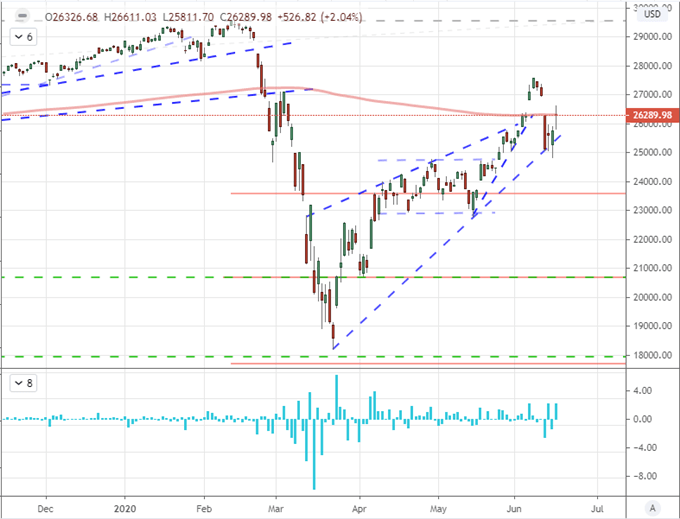
Chart Created on Tradingview Platform
As short-circuiting as the volatile but relenting progress from the US indices may have been, the breadth of gains from international indices, emerging markets, junk assets, carry and other measures of ‘risk’ still puts the drive in the bulls’ hands. If the masses can carry the resurgence further in the upcoming session, it will go a long way to establish a bias that materially hardens against future detrimental news.
Stimulus News Around the Fed and US Government Rouses the Optimists
When the economic readings of current conditions are as dire as what we are seeing on the docket nowadays, optimism requires more in the way of forward guidance. So long as investors are willing to throw their confidence into it, the central banks will be willing suppliers of hope. Tuesday morning, the Bank of Japan (BOJ) held its policy mix unchanged but its leader made clear that asset purchases was firmly planted and a rates would not be lifted through 2022 at earliest. More material for the short-term was the Fed’s efforts. The central bank announced an expansion of its existing program in bond purchases from ETFs to direct buying Monday evening, and the distribution of funds directly to businesses was met with enthusiasm. In contrast, Chairman Powell’s first day of testimony before congress didn’t seem to stir any latent enthusiasm. He suggested further waves of support may be necessary for the US economy but stuck to the line against negative rates. I will watch their consideration of this option nonetheless as well as the hotly debated yield curve control measure.
Chart of S&P 500 Overlaid with US 2year-10-year Yield Spread and 20-Day Correlation (Daily)
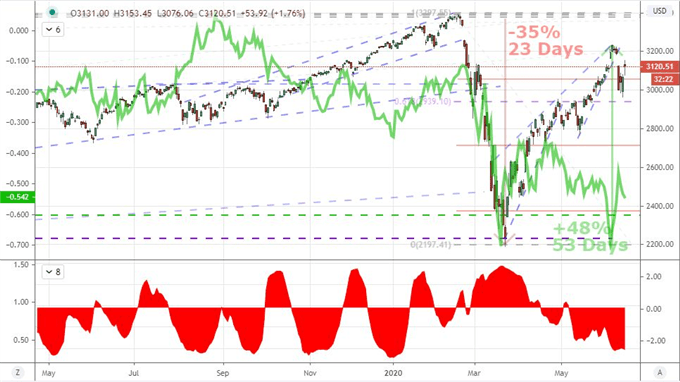
Chart Created on Tradingview Platform
Ahead we have the second day of testimony from the Fed’s leader, this time before the House; but the probability of an earth-shattering announcement not broached on day one is very low given the commitment to forward guidance these past years. As the most recent wave of support from the US and other major central banks is digested with market response considered, the questions of efficacy will grow louder and louder. That said, support form governments may extend the peace if strategically doled out. Reports this past session that the White House was working on the long sought-after, $1 trillion infrastructure spending program didn’t go unnoticed. Yet, this has been floated enough times without ultimate fulfillment that it is unlikely to serve as a permanent step to higher highs.
Chart of Major Central Bank Balance Sheets in Dollar Terms (Monthly)
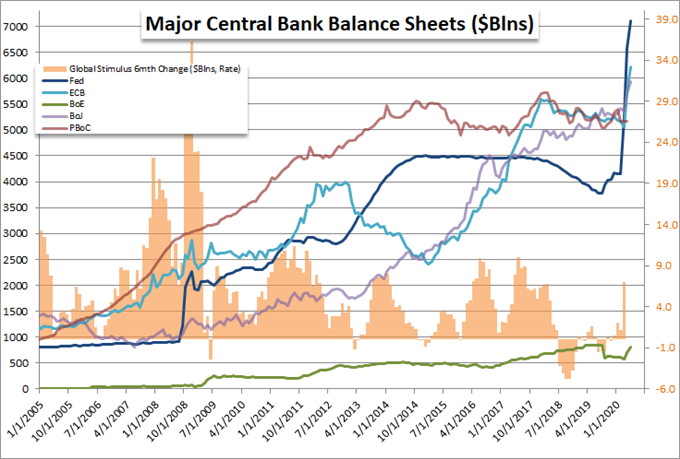
Chart Created by John Kicklighter with Data from Central Banks
A Second Wave of the Pandemic and All that Entails
I asked in a Twitter poll last week whether people believed that a second wave of the coronavirus pandemic was possible as governments moved to reopen their economies. Of the 150 people that contributed, two-thirds expected a second wave of infections. That doesn’t immediately mean that governments will move to shutdown their economies again in order to lower the curve, that a vaccine won’t soon follow or that stimulus won’t find a second wind. It just means the risk haunts some market participants’ forecasts, approximately two-third (65%) in fact if my sample size is indicative. That threat was made more tangible this past session when it was reported that Beijing had shut all schools in response to a swell in cases of coronavirus. So far, the USDCNH has offered a tepid response, but the true litmus test is broader risk trends given the first wave quite prominently started in China and spread to the rest of the world.
Chart of USDCNH (Daily)
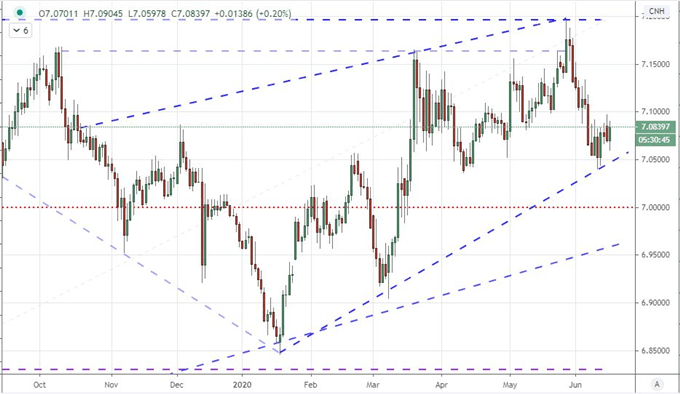
Chart Created on Tradingview Platform
The risk of a second iteration of the pandemic is not just an isolated threat for the world’s second largest economy. Tracking in the United States has shown a number of states are reported a rise in cases of positive tests and hospitalizations. Just this past session, reports from Texas and Florida showing significant increases urged serious reflection among investors – though not necessarily leaders who seem reticent to reinstitute lockdowns. This is the dilemma: cases are starting to rise again yet an already-troubled recovery effort risks completely falling apart if a second round of economic stasis is instituted without a commensurate stimulus to keep citizens and businesses whole. Keep tabs on search ranking around ‘second wave’ and ‘recession’ alongside the temperature checks for risk trends related to this underlying issue.
Graph of Global Search Ranking of ‘Second Wave’ and ‘Recession’ (Daily)
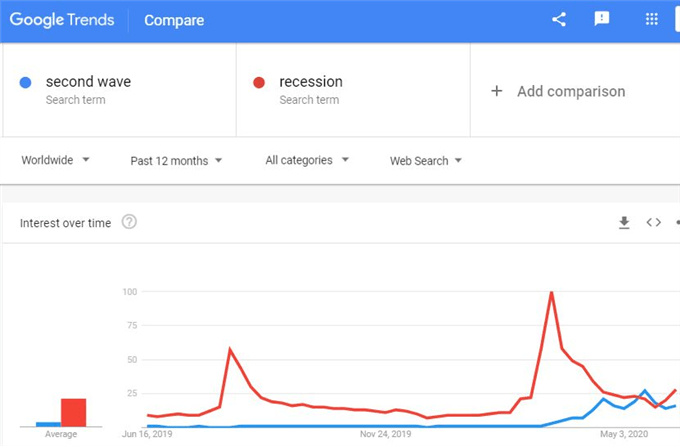
Chart from Google Trends

If you want to download my Manic-Crisis calendar, you can find the updated file here.
.


