


S&P 500, USDMXN, USDZAR, EURUSD, AUDUSD, USDCAD Talking Points:
- Fundamentals were loaded this past session between the global flash PMIs for May and news of escalating tensions between the US and China
- Risk trends have stalled at a precarious technical level, perhaps best defined by the S&P 500 between its 200-DMA at 3,000 and 61.8% Fib at 2,940
- Among the very few benchmarks attempting a true trend are EM FX pairs like USDMXN, USDZAR and USDBRL; while EURUSD, AUDUSD, NZDUSD and USDCAD are primed for range
Risk Trends Continue to Spin Their Tires as Fundamentals Fail To Ignite
Where markets were starting to lose traction Wednesday, there was an unmistakable slip for risk-oriented assets this past session. Failed breakouts spanned from the S&P 500 to EURUSD to the July WTI crude oil contract. That is not to mean that all hope has been abandoned by bulls, but it makes mounting the next stage that much more difficult while the risk of reversal rises quickly. If we were looking for a reasoning for the loss of conviction, I wouldn’t blame a shift in the fundamental winds. Sure, the May flash PMIs from across the globe were still far below zero, but the figures were better than expected against an already-anticipated deep recession. Further, the threats to return to return to reciprocal US-China economic sanctions is not exactly news. The masses have shown a tolerance for such news to pursue risk appetite on numerous occasion these past weeks, but sentiment itself seems to have stretched its boundaries and needs something more substantive.

Chart of S&P 500 with 50 and 200-Day Moving Averages and COT Positioning (Daily)
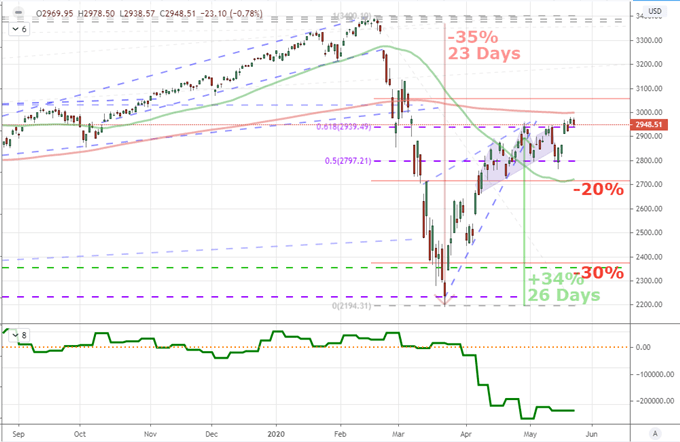
Chart Created on Tradingview Platform
When fundamental influence loses its sway over investor intent, technicals can often fill the vacuum. If that is the case, there are many high visibility boundaries that traders will have to consider against an assessment of their willingness to maintain exposure that is high risk, posing limited discount and yielding virtually no ‘income’ return (carry, yield, dividend). The S&P 500 remains the best mirror of broader circumstances in my book. The benchmark index has the combination of the 200-day moving average and psychological 3,000 level above. Almost immediately below is the former resistance in Fib and range break at 2,940. Now even a moderate move can leverage greater speculative anticipation.
Twitter Poll on S&P 500 Ability to Overtake 3,000
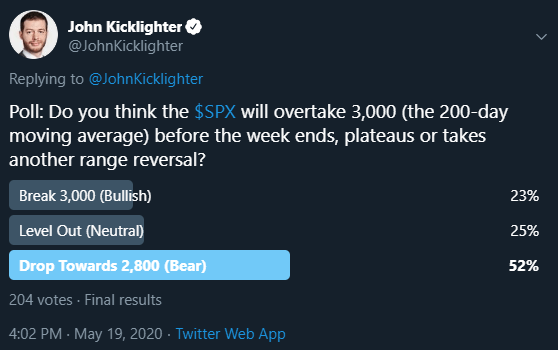
Poll from Twitter.com, @JohnKicklighter
Can the Exceptions to the Rule – Emerging Market FX – Continue to Diverge?
While most assets the markets over – particularly the ‘risk’ type – are showing reticence, there are always exceptions. At present, the emerging market currencies seem to be this phase’s alternative. While the EEM ETF joined US indices with a slip, some of the most liquid exchange rates to the Dollar were showing favor to the higher yield, higher risk currencies – a remarkable performance given the Greenback has fared well on a trade weighted basis. USDZAR (Dollar-South African Rand) extended its dive below its wedge support and 50 moving average and on to 17.50. That is particularly remarkable given the South African central bank cut rates 50bp this past session.
Chart of USDMXN with 50-Day Moving Average (Daily)
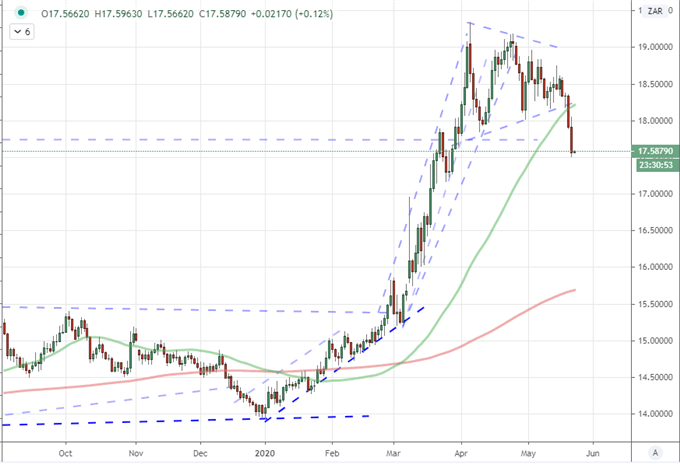
Chart Created on Tradingview Platform
One of the most liquid EM crosses I’ve been following, USDMXN, would also extend its slide against a remarkably similar pattern and add a 38.2 percent Fib break to the list. There are a few exchange rates with this similar pallor (like the USD-Russian Ruble), but there were also the more technically-provocative. USDBRL (Dollar-Brazilian Real) was just one such pair. Under near constant pressure, the pair managed its first material break from strong bullish pressure – and 20-day moving average – in 2020 with its -2.5 percent drop.
Chart of USDMXN with 50-Day Moving Average (Daily)
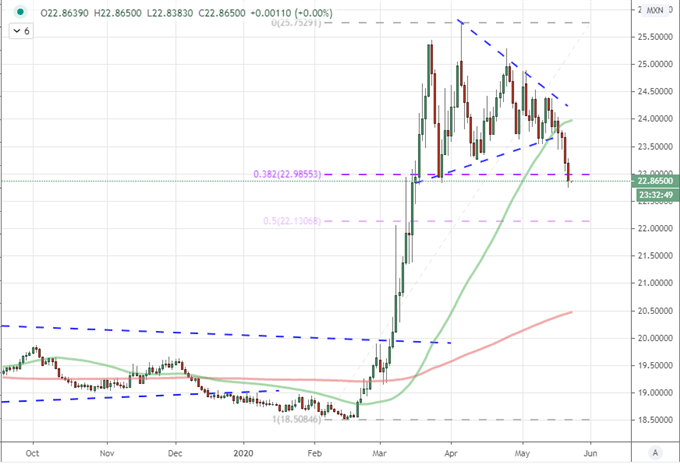
Chart Created on Tradingview Platform
The Many Assets Posturing for a Range Include: AUDUSD, EURUSD and USDCAD
When breakouts fail, ranges can often take their place. These market circumstances are direct counterparts of each other. A breakout is charged market condition that leverages technical barriers as spring boards for a subsequent flush of momentum. The mirror is compliance to the boundaries that drains conviction and can slowly lead to a turn in the market’s course. This potential is rife across the markets, but the Dollar is particular laden with the anticipation. AUDUSD has working with less confluence of resistance, but the retail FX expectation for a stall and collapse is remarkably strong in the IGCS (IG Client Sentiment) data.
| Change in | Longs | Shorts | OI |
| Daily | 9% | -2% | 5% |
| Weekly | -18% | 48% | -4% |
Chart of AUDUSD with IGCS Retail Speculative Positioning (Daily)
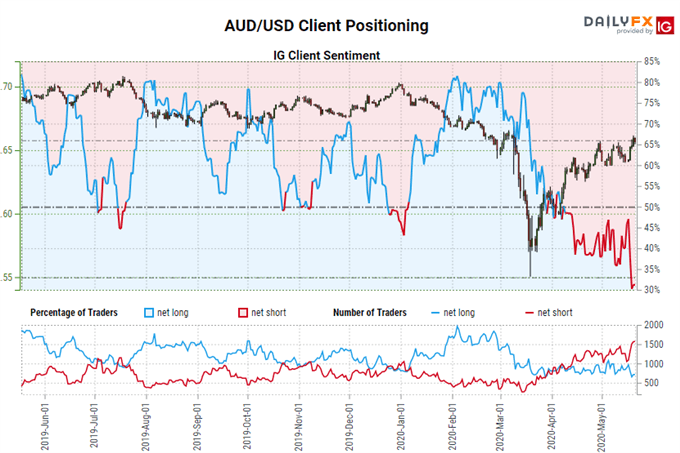
Chart from DailyFX IG Client Sentiment Data
More observant of its technical boundaries, EURUSD broke the combination of wedge resistance and the 38.2 percent Fib of its extraordinary March range only to stall shortly thereafter at the overlap of the 200-day moving average and range high at 1.1000. Here too, retail FX traders are increasingly confident of a reversal back towards the bottom of the multi-month range (around 1.0800 at present) as the net short positioning is at the same scale as the March 6th market high.
| Change in | Longs | Shorts | OI |
| Daily | 3% | 2% | 3% |
| Weekly | -9% | 25% | 3% |
Chart of EURUSD with IGCS Retail Speculative Positioning ( Daily)
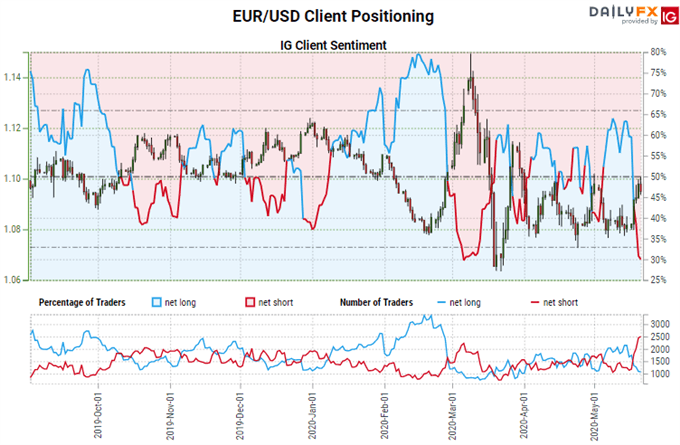
Chart from DailyFX IG Client Sentiment Data
Finally, a major I haven’t afforded much mention recently: USDCAD seems to be making even less bluster than most about attempting to clear its two-month long wedge floor. The 1.3850 floor is backed up by a confluence of technical milestones around 1.3800 (including a pivot and the midpoint of 2020’s range. This may not be the most amplified pair, but it is one to watch for its consistency.
Chart of USDCAD with 100-day and 200-day Moving Averages (Daily)
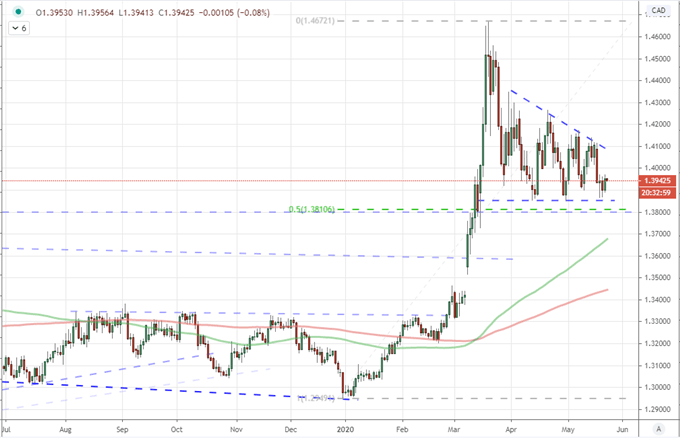
Chart Created on Tradingview Platform

If you want to download my Manic-Crisis calendar, you can find the updated file here.
.


