


S&P 500, Dollar, Euro, Gold Talking Points:
- Risk appetite made a remarkable recovery through this past session – a shift that pulled the S&P 500 back from a serious technical breakdown
- The turn in speculative mood happened despite the heads of the Fed, Bank of Japan and Bank of England playing down negative rates and further recession signals
- Event risk is heavy through the final session – from April Chinese figures to Euro-area 1Q GDP figures and US consumer sentiment data for May
A Recovery in Risk Appetite After the Break Already Occurs
After a two-day spill in risk trends, Thursday’s New York session opened to a troubling open. Beyond a simple gap lower from the previous session’s close to pace the worst three-day drop in weeks, but the S&P 500 as a benchmark found itself crashing through critical technical support levels. In the vicinity of the 2,800 area, the index was slipping through the midpoint of its February-March range following the sparks following a slide through the 20-day moving average and neckline of a month-long head-and-shoulders pattern. For all intents and purposes, it looked like this was a technical transition underway. Yet, there was a problem: markets have repeatedly rebuffed efforts to revive clear trends – whether bullish or bearish. We seem to have witnessed – for the time being – yet another failed attempt to forge a clear trend. Considering the weight this particular index carries among speculative observers, it says something about the lack of conviction that would follow so overt a technical move. By the day’s close, the S&P 500 put in for a hefty day-over-day rally and the emini futures put in for its largest tail as an intraday reversal since March 26th. Resistance to commitment is still a disruptive wind.
Chart of S&P 500 E-Mini Futures and Tails (Daily)
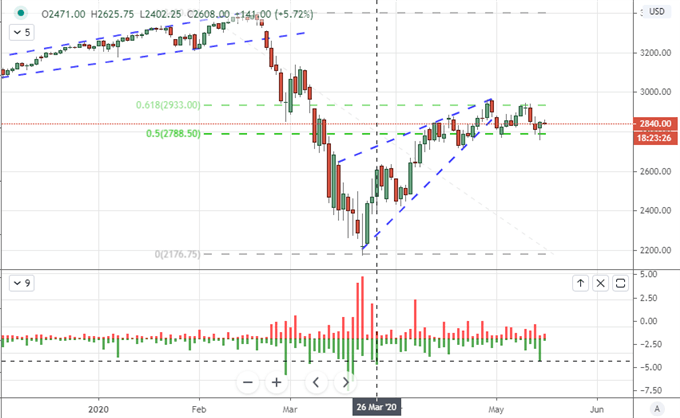
Chart Created on Tradingview Platform
Failure to translate a technical break into a full-fledged trend is a familiar theme across the market. I’ve noted false-break-reversals from the likes of the USDJPY, DAX, FTSE 100 and others. It is worth noting that many of the risk-sensitive benchmarks have been frequent offenders of this start-stop environment. Yet, these conditions are not isolated to this category of asset. Safe havens have struggled with a similar disconnect. Will this be the case for gold which saw a bullish wedge breakout just this past session? While such an event is always enticing and thereby draws the ‘this time is different’ mentality, it is important to consider the big picture market conditions. It’s worth noting that the metal’s bullish drive occurred on the same day as the broad risk appetite drive. This could be an undercurrent of skepticism in speculative holdout, but a lack of selloff will likely render the same for gold bulls.

Chart of Gold Overlaid with the S&P 500 (Daily)
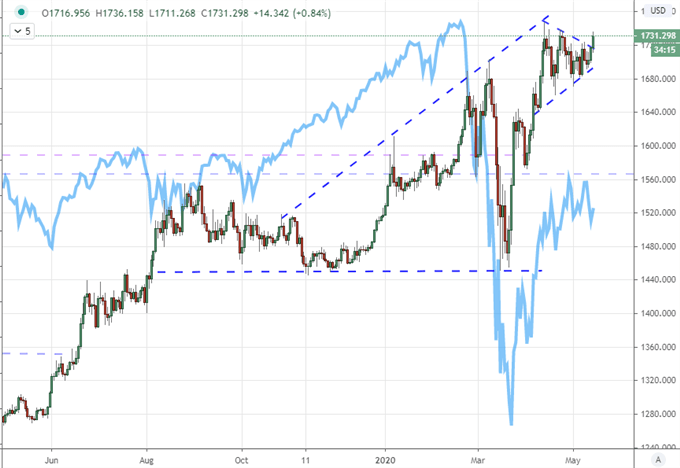
Chart Created on Tradingview Platform
Global Central Bankers Talk Down Negative Rates, Other Warnings Plague Sentiment
While fundamentals aren’t a necessary ingredient for risk trends, the backdrop was overtly contradictory of the late swell in optimism. In particular, leaders to some of the largest central banks in the world made clear their reticence to entertain lowering rates into (or further into) negative territory. Following Fed Chairman Jerome Powell’s fully expected rebuke to market expectations of the unorthodox path, Bank of Japan Governor Haruhiko Kuroda remarked that they were not currently considering further moving the benchmark deeper into negative territory from its present -0.10 percent standing. Later in the European session, the Bank of England’s new governor Andrew Bailey similarly remarked that they were not considering negative rates as an option – though he stated they wouldn’t write anything off in the event needs changed.
Chart of S&P 500 and Total Stimulus of Major Central Banks (Monthly)
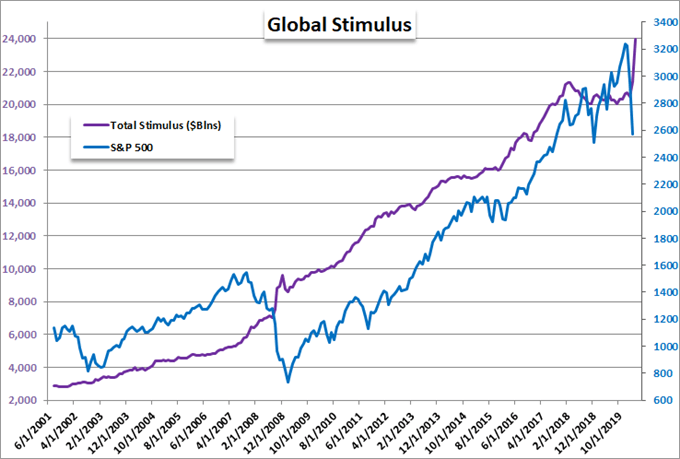
Chart Created by John Kicklighter, Data from Bloomberg
Interest rates and stimulus are at the event horizon of speculation where it is unclear what kind of impact it can have. For risk-grounded capital market assets, the risk of lost confidence is just as pronounced as the short-lived chase for yield such moves have inspired in the past. The same kind of distortion is showing through in FX rates. USDJPY for example has been on a divergent course since the most intense tumble in sentiment through March. Meanwhile, rumors of major blue chips facing bankruptcy, evidence of a rebound in coronavirus cases and reports that the US regulator had issued a report to exchanges and brokers to prepare for volatility or even negative prices on certain commodity contracts tugs at the fringes of confidence.
Chart of USDJPY Overlaid with the US-Japan 2-Year Yield Spread (Daily)
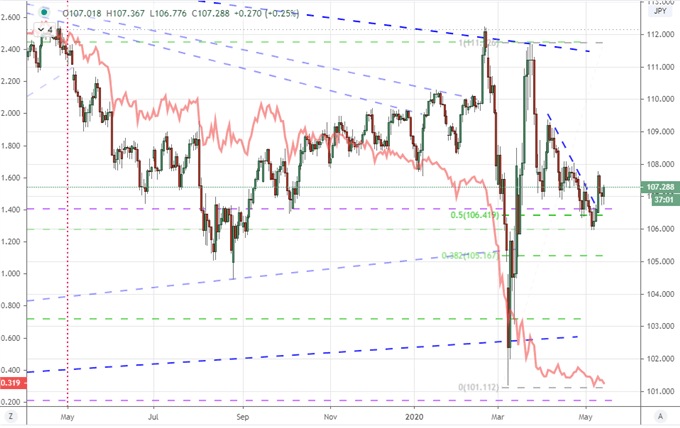
Chart Created on Tradingview Platform
A Run of Top Event Risk Through Week’s End
At the top of my list of matters to monitor for outsized market impact moving forward, the underlying matters of risk trends remains a principal concern. That shifts the focus on initial mover (catalyst) to self-sustaining momentum. That said, the sparks should be monitored for their potency. The most focused listing on my radar through the final session of the day is the US run of data. Retail sales will speak to critical internal demand, TIC flows for March will reflect what was happening at the height of the selloff while the March University of Michigan consumer sentiment survey will reflect upon the well-being of perhaps the largest collective economic group in the world. With USDCAD rounding lower after the BOC financial stability report this past session, perhaps Canada’s own capital flows report will further the range swing.
Chart of USDCAD with 100-Day Moving Average (Daily)
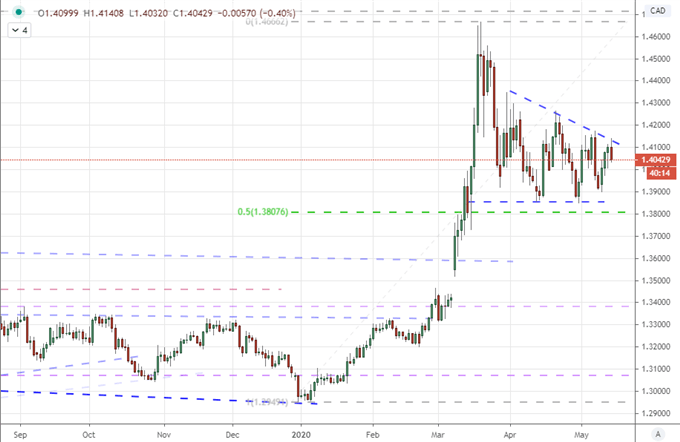
Chart Created on Tradingview Platform
Before the US session has the final say on the week, the Asia session will have posted a run of important April Chinese economic statistics. While the data and economy are supremely important for global health, the data draws serious skepticism from international investors. Taken more at face value are the statistics due from Europe. The Eurozone and German 1Q GDP figures in particular are important. If these economies cannot stem the bleeding, it is systemically critical enough that it can capsize the entire system. While EURUSD, EURJPY and EURGBP are important pairs to monitor, EURCHF is perhaps more directly a reflection of the Euro as the SNB struggles to keep 1.05 standing.
Chart of EURCHF with 50-Day Moving Average ( Daily)
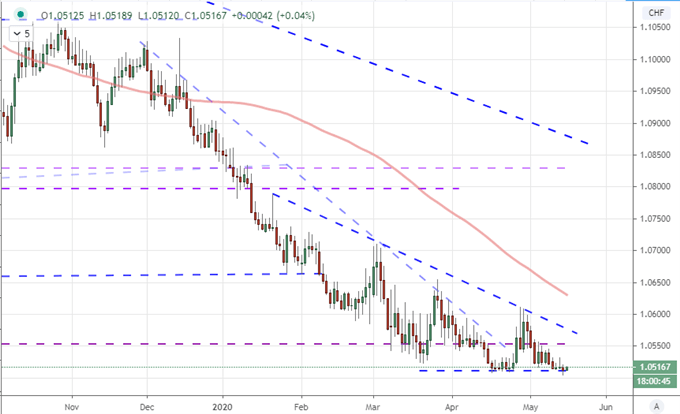
Chart Created on Tradingview Platform

If you want to download my Manic-Crisis calendar, you can find the updated file here.
.


