


Gold, S&P 500 and DAX Talking Points:
- Top fundamental theme Thursday was the severity of the recession we have to look forward to, punctuated troublingly by the extreme PMI readings
- Stimulus was making another herculean effort to offset the oncoming recession with the Fed’s commitment of intraday funds out-classing the EU’s January 1st recovery program
- S&P 500, DAX and other risk assets managed to weather yet another unfavorable wind, but gold’s climb suggests risk aversion is still an undercurrent
Risk Trends Tread Water: An Impressive Performance
This past session saw many of the benchmarks of risk trends that I watch spin their tires. That could be interpreted as generally disappointing but for the caveat that the fundamental event risk on tap was unmistakably troubling. A host of global data that stands as a proxy for timely, GDP figures showed an even more severe plunge into recessionary territory than was already expected. If that is our backdrop, measured losses – much less modest gains – are something of a coup.
| Change in | Longs | Shorts | OI |
| Daily | -3% | -2% | -3% |
| Weekly | -5% | -6% | -6% |
Chart of S&P 500-based SPY with DAX Index (Daily)
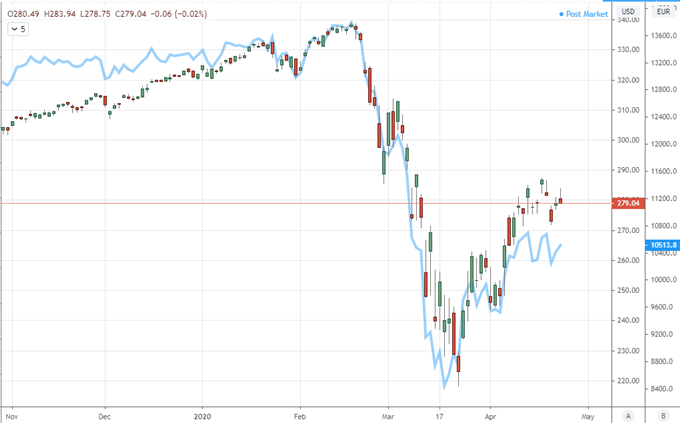
Chart Created on Tradingview Platform
In tracking the progression of risk trends through the sessions Thursday, there was stubborn buoyancy through much the day until the US session solidified an afternoon swoon. The timing led some headlines to tie the slump in sentiment to headlines that suggested biopharmaceutical company Gilead - whose coronavirus drug, remdesivir, had supposedly had strong anecdotal evidence in efficacy last week – supposedly suffered a negative result on its first trial. If indeed this were the motivator, risk aversion could carry actively into Asia trade; but it could just as readily prove a regular wobble in risk trends. On the other hand, the US President’s tweet seemingly instructing the US Navy to ‘destroy’ any Iranian gun ships that harassed the country’s vessels didn’t seem to worry market participants at all.
Recession Warnings Hit a New Altitude While Stimulus Has an Uneven Flight Plan
While the market didn’t seem to commit fully to a sentiment swing in one direction or the other, the steadfastness stood out against the backdrop of red shown around the global economy. There were really no bright spots to speak of in the April figures. Japan’s Composite dropped to 27.8, the Eurozone’s to 13.5, the UK’s to 12.9 and the United States’ comprehensive measure to 27.4. Anything below 50 is ‘contraction’ with all proving worst than expectations and most hitting record lows. That seems to fit the Great Depression comparison that is so frequently referenced nowadays. It is important to recognize the constant reminders of economic pain with last week’s IMF WEO (World Economic Outlook) and next week’s official US and Eurozone 1Q GDP figures on tap.
Chart of the US Composite PMI from Markit Overlaid with GDP (Monthly)
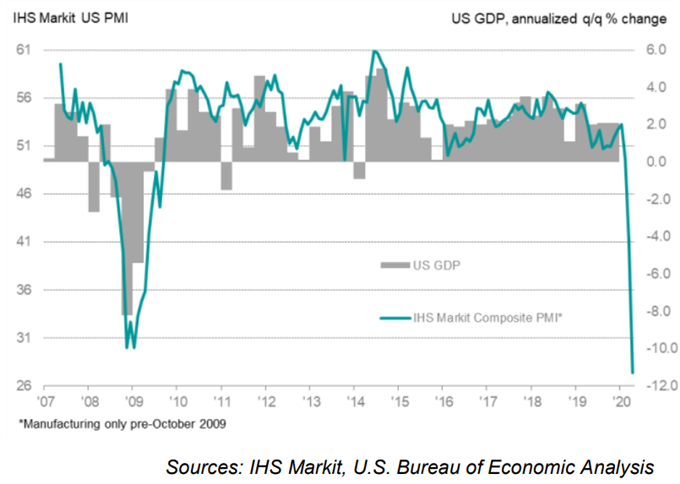
Chart from MarkitEconomics
The most capable offset to economic struggle to this point has been the rising tide of stimulus global authorities have continuously fed. This past session, we were met with yet another upgrade. The Federal Reserve announced in a statement that it was increasing intraday credit availability to support the government’s payment protection program and small business lending. Europe attempted to feed its own enthusiasm with a European Council meeting which seemed to tout more common ground among leaders. Yet contradictory to any nascent enthusiasm, discussions of a large EU Recovery Plan set an actual start date out to January 1st. Furthermore, ECB President Christine Lagarde reportedly stated that officials did ‘too little too late’ and warned the economic fallout could be as severe as a -15 percent contraction.
Chart of Global Search Interest in ‘Recession’ and ‘Financial Crisis’ Via Google Trends
Chart from Google Trends
Euro and Gold Track Out Different Courses
Speaking of Europe’s struggles to provide enough financial charge to offset a growing recession, the Euro seems to be showing some deference to its struggles. EURUSD, EURGBP and EURJPY have all started to slide through near-term congestion support. The cross I’m watching more closely, however, is EURCHF which seems to be putting serious pressure on a level that may be in the Swiss National Bank’s (SNB) crosshairs.
Chart of EURCHF (Weekly)
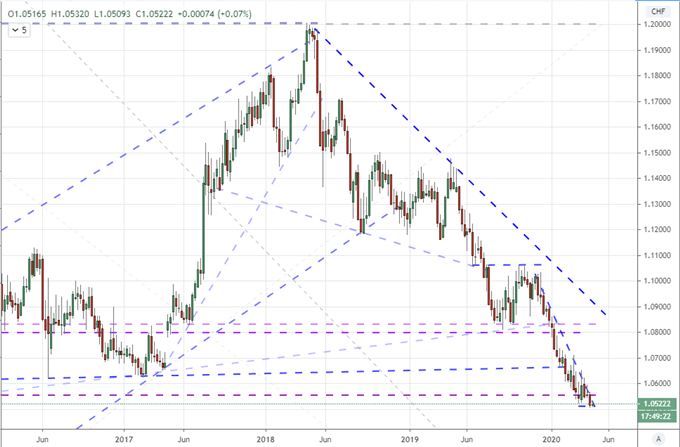
Chart Created on Tradingview Platform
Meanwhile, the uncertain backdrop for risk appetite combined with the scattershot efforts to fight the fire in enormous infusions of stimulus continues to lift gold. The commodity climbed to its highest levels since December 2012 alongside the Fed news. Looking at the metal’s pricing in an equal indexing against the Dollar, Euro, Pound and Yen; the market is pushing fresh record highs. Regardless of the surface level perspective of risk trends, the backdrop of financial strain and stimulus seems to come through clearly in gold.
| Change in | Longs | Shorts | OI |
| Daily | 3% | -2% | 0% |
| Weekly | 8% | -8% | 0% |
Chart of Equally Weighted Gold Index (Daily)
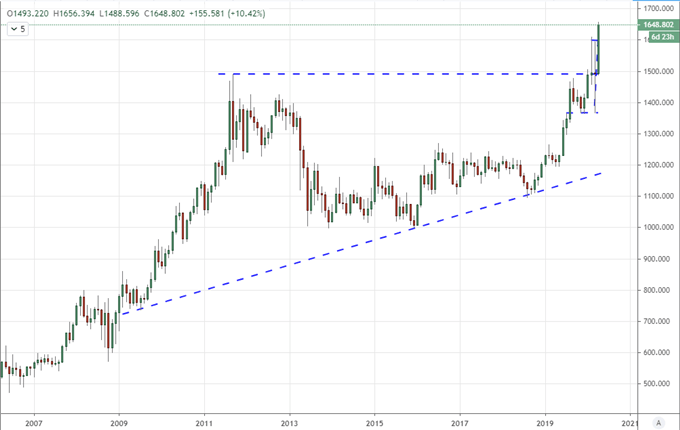
Chart Created on Tradingview Platform

If you want to download my Manic-Crisis calendar, you can find the updated file here.
.


