


S&P 500, Crude Oil, Shanghai Composite Talking Points:
- Risk trends were in retreat this past session with a particular loss of altitude during US session hours
- Crude oil suffered an acute collapse Monday with an unprecedented slide into negative prices for the active WTI contract with lasting growth implications
- Standard economic listings present less pressing risk through the immediate future as systemic threats like reinforcement of recession set in
Risk Trends and Oil’s Historic Collapse Into Negative Territory
If you are like myself, your eye naturally hones in on remarkable moves in the open markets. Where volatility is the qualifier, there was no spark to attract the attention more readily than the extraordinary 300 percent collapse in US crude oil into negative territory. Any trader that analyzes the ‘global’ financial picture would be remiss not to account for that incredible move to open the week. The benchmark active US futures contract (WTI for May) not only posted its steepest loss on record, it slipped into negative territory for the first time. That collapse seems to be the convergence of a ‘demand’ implosion as a result of recession expectations and distorted liquidity conditions as most of the energy market rolls forward to the June contract. There were particular aspects of the market that exacerbated this incredible turn, but we shouldn’t completely write off this development due to technical factors. Without an anticipated and steep recession, this crude slump would not likely have developed.
| Change in | Longs | Shorts | OI |
| Daily | 0% | -7% | -2% |
| Weekly | -7% | 1% | -5% |
Chart of Dow Index Overlaid with US-Based WTI Crude Oil Futures for May (Monthly)
Chart Created on Tradingview Platform
It would be easy for the energy market to fully distract us from what was going on in the broader financial markets to start this new trading week. Crude’s tumble was both unique while also standing as a reflection of the current circumstances of global system. A sudden and severe global recession creates an environment in which such an astonishing development is possible, but it is likely to create other rifts as well. That is hard to align to the steady recovery among the likes of US indices over the past weeks. The S&P 500 was put off of its charge Monday with a gap lower and subsequent slide through the close, but the intensity of the decline was far far less unnerving than what was seen in the oil market. That said, should the panic sentiment spread from the localized asset class into the broader capital market, this development could prove a spark to turn us off of another complacency drift into the next severe bearish leg. Mind sentiment closely.
| Change in | Longs | Shorts | OI |
| Daily | 6% | -5% | 1% |
| Weekly | 7% | -10% | -2% |
Chart of S&P 500 Emini Futures with Daily Gaps and Rate of Change (Daily)
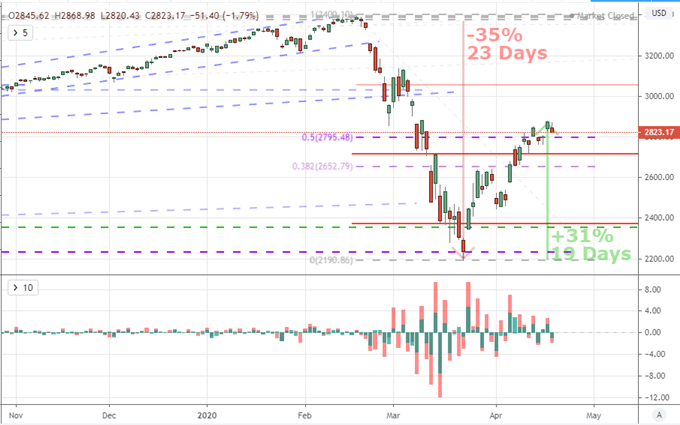
Chart Created on Tradingview Platform
Netflix Versus United – Another Reminder of Recession
Our current economic situation is very likely at the root of the incredible collapse for oil, which happens to be one of the benchmark assets I follow as a measure for risk trends influenced by growth, but it isn’t the only metric. Copper and US Treasury yield spreads are two other measures I track for the unique combination of speculative distortion and ‘rudimentary’ economic valuation. In the meantime, the data-based reminders of hardship are proving abundant. The global macro docket was relatively light through the past session with data like the Chicago Fed’s National Activity Index leading the way. That offered an opening for United Airline’s earnings to be a top listing. The airliner reported a $2.1 billion loss for the past quarter with a warning that it was seeking a further $4.5 billion in federal government support beyond its $5 billion payroll grants.
As far as Corporate America goes, the air service companies would be among the most directly effected industry in a forced economic shutdown brought on by a global pandemic. The antithesis for hold out optimists would be a situation like that of Netflix. The streaming service is one of the FAANG members and a tech company whose revenues are not hurt by the closure of brick and mortar institutions. That is perhaps why NFLX and the grouping of high-flying tech firms has held up so well in the aftermath of the March tumble. That said, the bar has been set remarkably high for such a ticker and such a sector. Disappointment is a very real risk.
Chart of Netflix Overlaid with the Nasdaq Composite
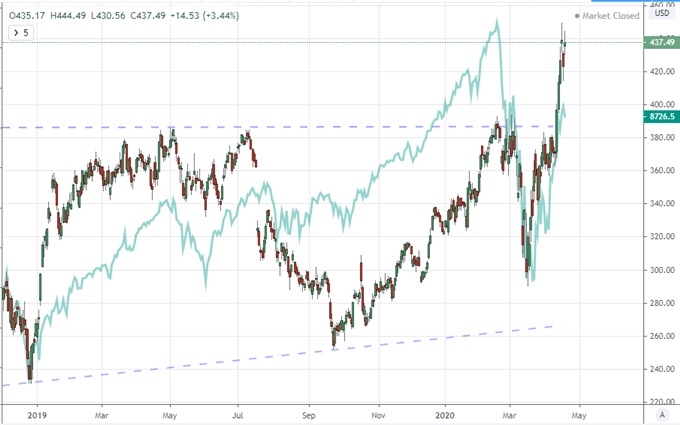
Chart Created on Tradingview Platform
A Reminder of Stimulus’s New Influence in These Conditions
As we measure the sometimes erratic nature of speculative appetite against the backdrop of known recession, it is important to keep tabs on the foundational developments upon which sentiment turns. On the stimulus side, there were a few further updates to seed some moderate enthusiasm. China cut its one-year and five-year prime loan rates for the second time this year in a localized stimulus effort. Meanwhile it was reported that the US government was close to a recharge of its massive stimulus program – dubbed ‘Phase 3.5’ which could surpass $470 billion to add funds to the tapped PPP while adding funds for disaster loans, hospital shortfalls and coronavirus testing.
Chart of S&P 500 Overlaid with US Federal Deficit as Percentage of GDP Through October (Daily)
Chart Created on Tradingview Platform
In contrast to the stimulus side, the reminders of our economic reality were also readily furnished. In addition to the US economic activity reading for the Chicago Fed branch and the earnings reminder, there was news from an auto industry group, LMC, that auto industry output the world over could be reduced by 20 million vehicles. A far more controversial update was the news that some States Governors in the US were fast tracking the opening of their economies. This is a heavily debated consideration over whether a forced economic shutdown could prove as bad or perhaps worse than the scourge of the pandemic. Regardless where your personal views fall, an early open will stand as a litmus test as to where the global status may fall moving forward.

If you want to download my Manic-Crisis calendar, you can find the updated file here.
.


