


S&P 500, USDCNH, USDMXN Talking Points:
- It will be difficult to follow up on risk appetite as strong as it was this past week with Monday seeing US and Japanese markets open while Europe remains closed
- Event risk will compete for short-term attentions, but the question of stimulus will start to show more distortion for the likes of HYG, EURUSD and more
- There are many interesting charts to watch beyond SPX, VIX and Oil; Gold, AUDCAD, USDMXN and more are worthy of your attention
Risk Trends Gauge Fundamental, Volatility and Liquidity
There were fewer corners of the global market open for trade through Friday’s session, which would normally be a reason for investors to assume an early drain of liquidity and no material development in speculative sentiment. Yet, we are dealing with very different circumstances these days. The market turmoil of the past month is still fresh in most minds and the hold over volatility is still evident in both data points, derivatives and investors’ actions. Risks accounted for, the more than 12 percent charge from the S&P 500 from Monday through Thursday (the biggest weekly rally since 1974) carried confidence through those markets still open for Friday into the weekend. We will still have a short-term holiday liquidity question to deal with Monday as European and Australian markets among a few others will be offline again. That will lead me to put my focus on the Nikkei 225 and S&P 500 open, looking for any gaps. While some may welcome a bullish gap, I would see that as a continuation of exceptional volatility and unlikely to hold course against a known recession.
| Change in | Longs | Shorts | OI |
| Daily | -3% | -2% | -3% |
| Weekly | -5% | -6% | -6% |
Chart of S&P 500 with 20-Day Moving Average and Daily Gaps (Daily)
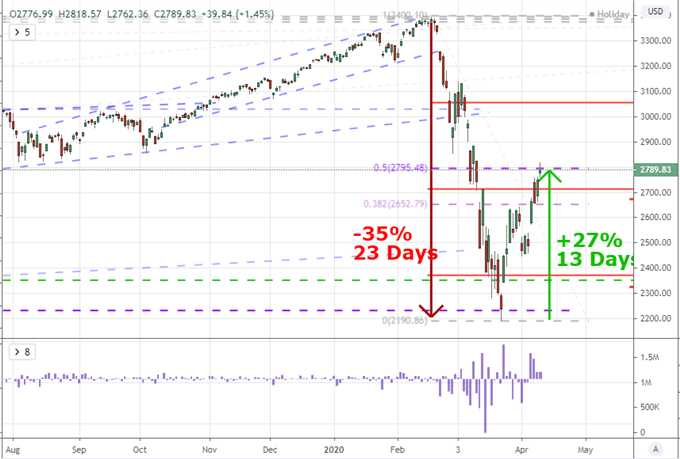
Chart Created on Tradingview Platform
Something to ask yourself over the weekend is whether you would label the S&P 500 – or other similar risk benchmark – as being currently in a bull market or bear market. You can see the results of my Twitter poll below. The US index has technically moved sufficiently to qualify for a bull market, but it does so after a record-breaking (in pace) collapse into a bear market. Different people would read this situation differently according to their duration, their risk tolerance, their preference for analysis and more. The point is that the market is an amalgam of many different views. It is important to differentiate our own views from those of the market as a whole.
Twitter Poll Asking Traders Whether They Would Label Current Conditions Bullish or Bearish
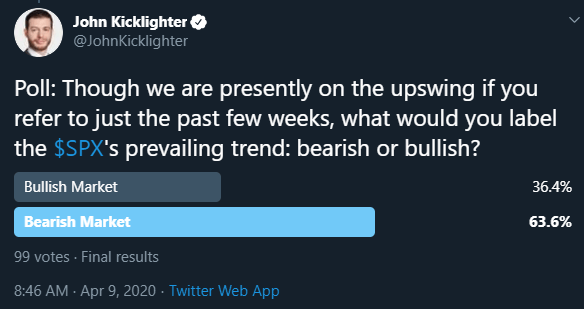
Poll from Twitter.com, @JohnKicklighter
An interesting observation from those watching the flows in funds that are increasingly standing as stand-ins for portfolio views of the market: despite the climb in markets themselves, there was a large exodus from these same indicative products. This is not necessarily indicative of anything definitive, but it does speak to the disparity for the conviction of the masses – and the implications of liquidity and volatility.
Chart of S&P 500and Capital Flows Into/Out Of Funds (Weekly)
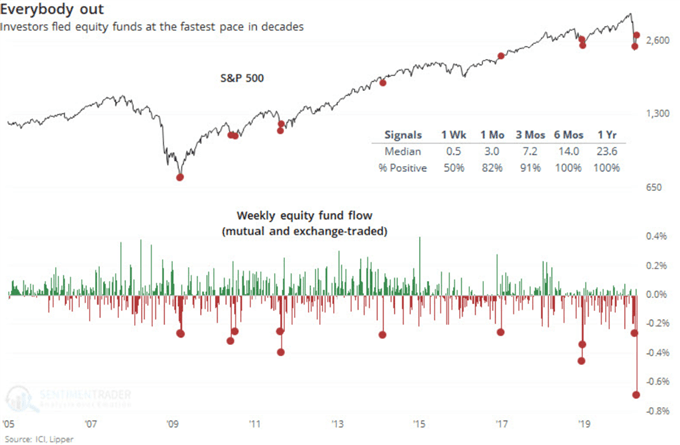
Chart from Sentiment Trader on Twitter.com, @sentimentrader
The Influence of Stimulus Beyond Providing Stability
As we move into the new trading week, I will direct much of my attention to the scheduled and unscheduled updates that affirm a recession is setting in – to that point Bloomberg’s US economic forecast and PIIE global forecast were just the most recent reminders of the pain at hand. Yet, we are also receiving a steady run of favorable stimulus news to help ward off the full impact of an inevitable crunch. The Fed’s massive $2.3 trillion lending program this past week was one such follow up wave. This can generally reinforce risk appetite, but as we move back from the extremes of panic and greed, we will also start to see nuance arise. ‘Front run the Fed’ is a refrain from 2009-2012, but it seems to be arising again now with the junk bond ETFs like HYG and JNK as the central bank moves into investment rated bonds.
Chart of HYG Junk Bond ETF and Fed Balance Sheet (Weekly)
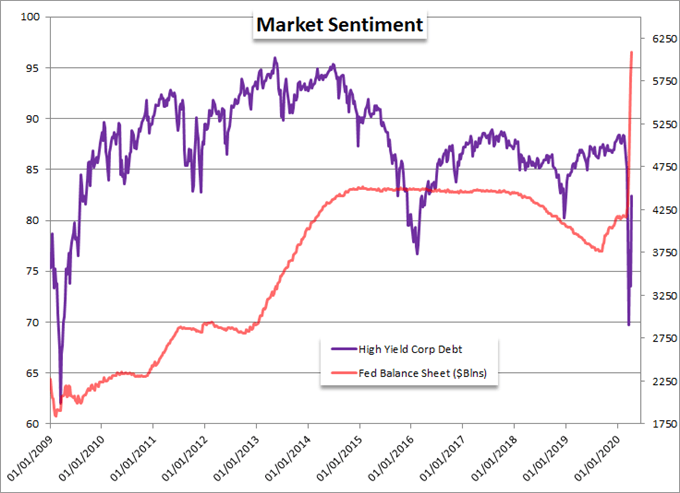
Chart Created by John Kicklighter with Data from Bloomberg Terminal
Another benchmark for the global markets that will shift as the nuance starts to replace the heavy-handed speculative oscillation may be EURUSD. This pair has exhibited a lot of volatility in the very recent past with the Greenback playing the role of extreme liquidity haven when fear peaked. Yet, as we move forward relative stimulus can play its role like it did back in 2014. Back then, the ECB threatened to add to stimulus unless the exchange rate dropped. Then, more stimulus was seen as a driver for cheaper local currency. Nowadays, more support is looking more like a faster reversal in economic fortunes and may actually boost capital inflows (and the thereby the currency). With the contrast between the EU-US and ECB-Fed, this will be an important pair to watch.
Chart of EURUSD with Net Speculative Futures Positioning (Monthly)
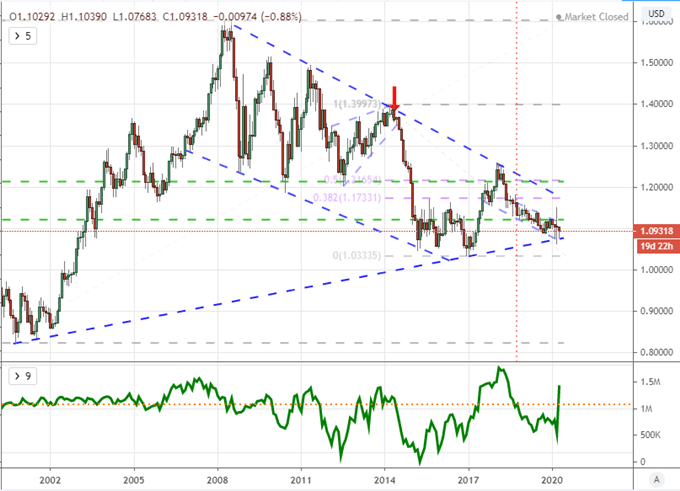
Chart Created on Tradingview Platform
A Range of Interesting Markets to Watch Next Week
As we start to back away from the precipice of crisis – and the promise of pure speculative charge registers as too good to be true by even the bulls – I’m looking at more of the particular fundamental and technical potential staged for the week ahead. While there is a lot to draw from, the Australian Dollar seems to have a few sparks to draw from. Locally, the Australian employment data is targeted, but I will also watch this currency more closely than even the Yuan when China reports its foreign directed investment, trade and 1Q GDP updates. That makes for a lot of Aussie crosses to select from, but the technical overhead of AUDCAD and BOC rate decision should make this particular pair interesting.
Chart of AUDCAD (Daily)
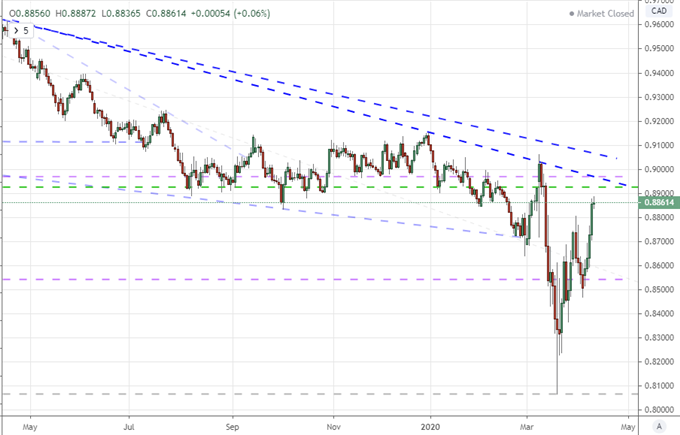
Chart Created on Tradingview Platform
The emerging market currencies are another segment of impressive technical pictures and highly turned risk benchmarks. While I’m watching USDRUB, USDBRL and USDZAR for different reasons; USDMXN is my preferred benchmark. Not only is the price chart remarkable, but the activity behind the scenes is extremely impressive. The average daily range for the pair is nothing short of exceptional in the liquid FX market. Further, the net speculative positioning (via futures) shows incredible trading around this currency pair. This makes for a remarkable candidate between exceptional volatility and liquidity.
Chart of USDMXN and Net Speculative Futures Positioning (Weekly)
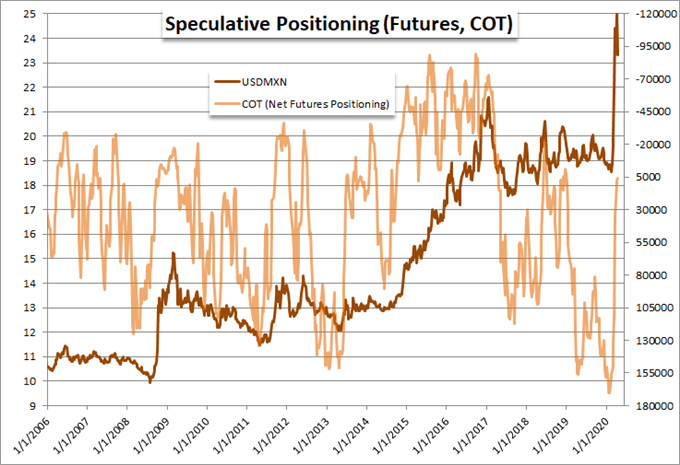
Chart Created by John Kicklighter with Data from Bloomberg Terminal

If you want to download my Manic-Crisis calendar, you can find the updated file here.
.


