


S&P 500, Canadian Dollar, Oil Talking Points:
- The S&P 500 closed out its best week since 1974 despite a holiday shortened period and reminders of recession like the initial claims and sentiment
- Economic data Thursday reinforced the onset of recession between the 6.6 million in US jobless claims, 1.01 million net Canadian job losses and NIESR 15-25% GDP slump
- Extending the incredible wave of global stimulus, the EU agreed to half a trillion in coronavirus aid while the Fed announced a move into investment grade bonds
Maintaining Risk-On Through the Holiday Liquidity Drain
Heading into the extended holiday weekend for the Western World, I was watching to see whether there would be another rush to the exits before liquidity drained from the system. It is important to remember that the evidence of recession will continue to build pace through the near future as the natural delay in records slowly catch up to the effects of self-imposed economic shutdowns. The data this past session clearly evidenced sharp economic reversal, but that didn’t throttle the climb in speculative benchmarks. My preferred measure of speculative appetite, US indices, closed out a strong (shortened) week. The S&P 500 gapped higher for a fourth consecutive trading session – a first back to February 6th – and extended the climb from the March 23rd low for a 27 percent rally in a mere 13 trading days.
| Change in | Longs | Shorts | OI |
| Daily | 5% | -3% | 1% |
| Weekly | 21% | -19% | -2% |
Chart of S&P 500 with 20-Day Moving Average and Daily Gaps (Daily)
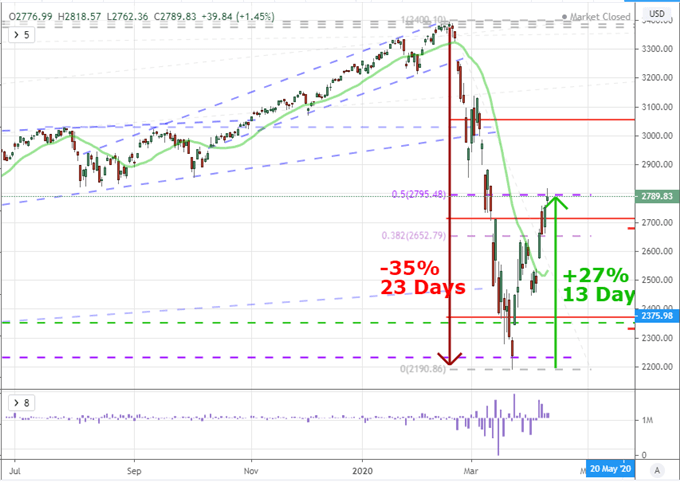
Chart Created on Tradingview Platform
The rally through this past session has fostered a sense of confidence among some market participants that simply default to bullish view or those simply desperate for stability to return. Though the definition is a loose one, an advance of more than 20 percent from lows is often described as a return to bear market. This swing to bullish intent is one of the fastest on record – following an explicit record for tipping into a bear market through March looking back through the history. A market participant could argue a bullish or bearish view on the market with these kinds of statistics, but it is important to remember the backdrop of the financial system: a persistently high level of volatility; an outlook where the docket will continuously reinforce recession and one of fragile financial structure. In a poll, asking traders how they would label our current market conditions, nearly two-thirds said they still see the markets in a ‘bearish market’ despite the past weeks’ rally. Remember, there can be corrections in prevailing trends.
Twitter Poll Asking Traders Whether They Would Label Current Conditions Bullish or Bearish
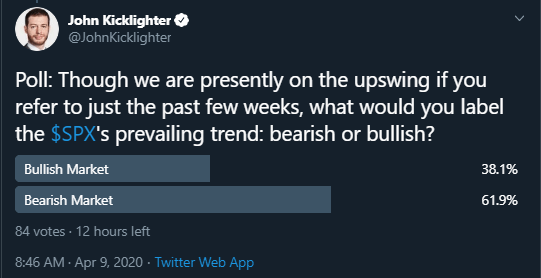
Poll from Twitter.com, @JohnKicklighter
Stimulus Charged Even Further as Economic Troubles Build
Testing the balance of confidence this past session, there was both a run of data that reminded us that the global economy was struggling, but there were also headlines proving the authorities continue to fight back the gloom. Out of the United Kingdom, the NIESR updated its GDP tracker beyond the February figure to project a first quarter slump for the country of potentially -5 percent. The group warned depending on the timing of reopening the economy, 2Q could contract as much as -15 to -25 percent. In the US, the initial jobless claims presented another 6.6 million initial filings for unemployment benefits and 7.46 million continuing claims. Of similar stature, the University of Michigan’s consumer sentiment report dropped to a reading of 71 from the previous 89.1 print. Yet despite these numbers, neither the Dow, FTSE 100 nor GBPUSD seemed to fare poorly for the news.
Chart of GBPUSD (Daily)
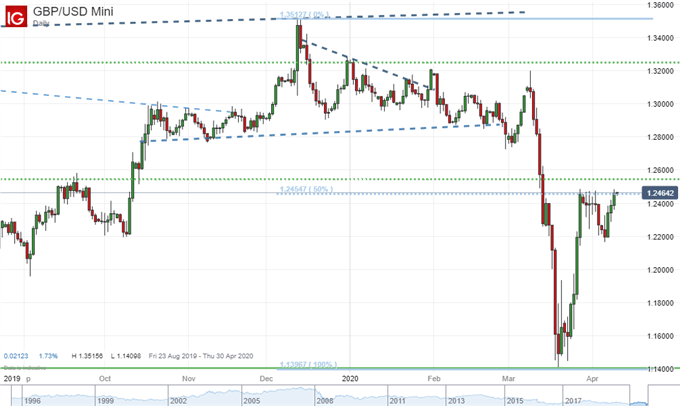
Chart from IG Trading Platform
Perhaps one of the countervailing winds to these reminders of pain was the fresh iterations of stimulus. Given the scale of support the world’s largest economies and central banks have already injected, I am surprised that we are still seeing significant infusions. And yet, the fresh support is unmistakable. There were two material efforts to mark Thursday. The European Union finally passed half a trillion in stimulus for its economy after significant infighting. As significant as the program may be, it pales in comparison to the enormous effort out of the US. The Fed added to the effort Thursday announcing another $2.3 trillion in lending to the markets including expansion in potential purchases to include some investment grade debt which could see it into junk bond ETFs like HYG and JNK as well as so-called “fallen angel” paper.
Chart of HYG Junk Bond ETF with 20-Day Moving Average and 1-Day Rate of Change (Daily)
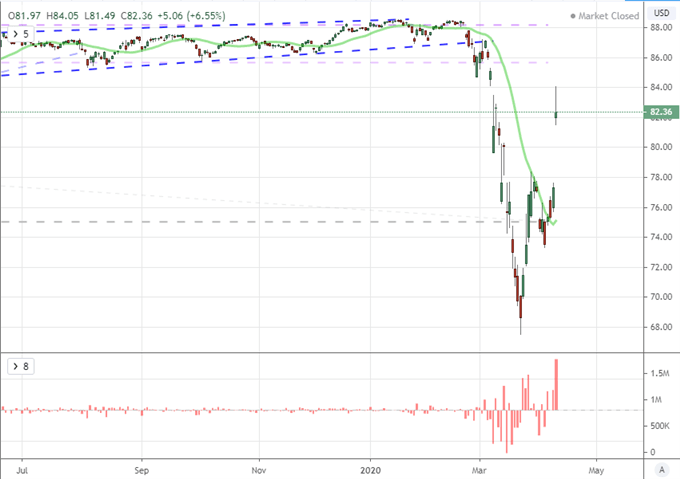
Chart Created on Tradingview Platform
Surprising Moves from the Loonie and Oil
While the big picture moves remains my focus, it is important to monitor the impressive individual moves being made in the market. There were two particular highlights that impressed me Thursday for the level of restraint rather than any extreme move they registered. The Canadian Dollar absorbed an incredible employment update with a net job loss of 1.01 million position and surge in the unemployment rate from 5.6 to 7.8 percent. That is a surge that outpaces the US – an economy with a significantly greater population. Nevertheless USDCAD and the TSX index were rather apathetic to the reading. Perhaps Prime Minister Trudeau’s employment protection efforts preceding these numbers has set a deep discount.
Chart of USDCAD (Daily)
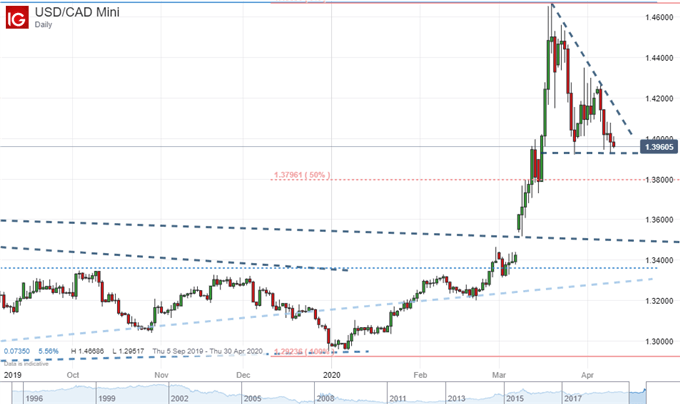
Chart from IG Trading Platform
Another unexpected move would come from crude oil. The highly contentious meeting of OPEC+ to discuss production cuts did not provide official relief in global output, but there were encouraging signs. With some holdouts supposedly warming to supporting a global effort (such as Mexico and Russia), it seemed that rumors of a 10 million barrel per day cut could be found. Despite this promising course, crude oil would still drop on the day.
Chart of US Crude Oil and OVX Oil Volatility Index (Daily)
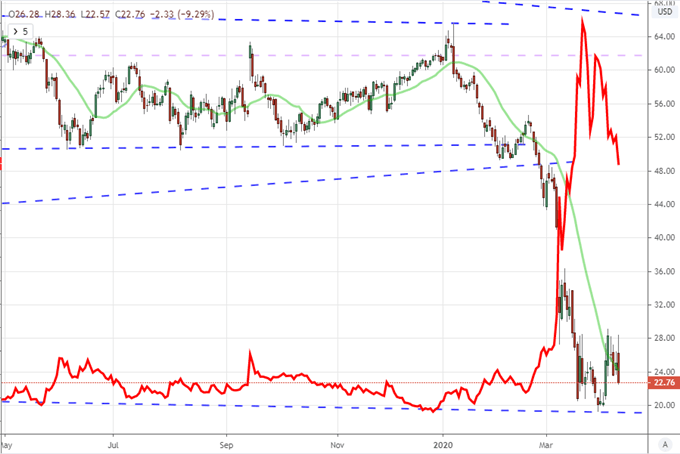
Chart Created on Tradingview Platform

If you want to download my Manic-Crisis calendar, you can find the updated file here.
.


