


Dow and Dollar Talking Points:
- The Dow’s 21% three-day rally was the largest dating back to 1933 and a technical return to a ‘bull market’
- Though this week has offered some balance to beaten financial markets, there remains a deep skepticism that aligns well to the persistently high volatility
- A more than $2 trillion stimulus program in the US looks like it will be signed off before the week closes, but reminders of recession will long extend this tide of support
A Bull Market that Few Believe In
After the rout we have experienced these past five to six weeks, there is a certain level of desperation among the market’s rank. That pandemonium puts many traders in a position to seek relief – regardless of how questionable the source of the relief. Further movement on the massive US stimulus package offered something fundamental to refer to, but there is little reason to legitimize the market’s more speculative inclinations. It was the climb in capital markets led by an extended surge for US indices that would have seriously convinced anyone of a speculative opportunity. While the gains were broad, it was the Dow’s 6 percent charge that extended a three-day rally that registered a 21 percent performance. Historically speaking, that is the largest rally over that short span going back to 1933.
| Change in | Longs | Shorts | OI |
| Daily | -15% | 4% | -4% |
| Weekly | -18% | 19% | 2% |
Chart of Dow with 3-Day Rate of Change (Daily)
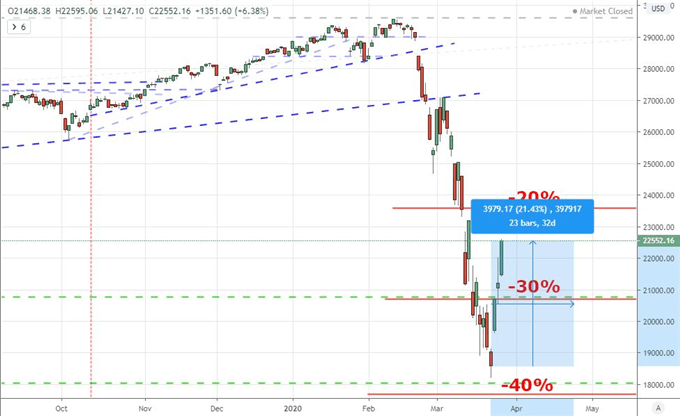
Chart Created on Tradingview Platform
Without context, such an incredible move would seem the genesis of an exceptional rally. However, it is difficult to miss the background upon which this rebound has developed. The foundation of the exceptional three-day move is not a fundamental motivation but rather the settings on volatility. While the US indices have charged higher, the VIX volatility index remains above 60 – a reading that is readily categorized as ‘extreme’. That isn’t a contrast between surface performance and contradictory underlying current reserved for US equities. A similar disparity can be seen in many of the preferred risk assets across the financial spectrum. Despite the draw of a sharp rally in dark market conditions, my poll asking traders what they thought was afoot with this market shift seems to indicate most maintain a very high dose of skepticism. I think that is wise .
Poll from Twitter on the Dow’s Trend
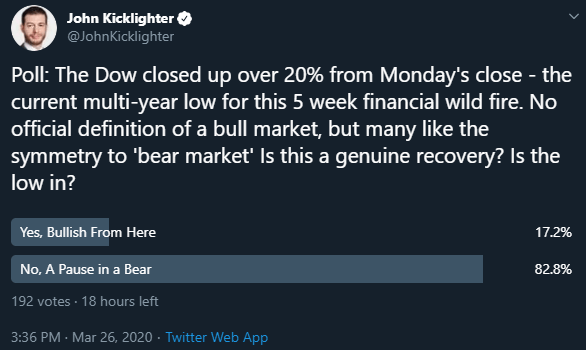
From Twitter Handle @JohnKicklighter
The US Introduces its Massive Program and Now We Coast
After significant back and forth, the United States Congress seems to be in the final leg of approving its massive stimulus program totaling more than $2 trillion. It is impossible to officially attribute this week’s recovery effort to assumption surrounding this unprecedented effort, but it seems very likely that the sizable escalation acted alongside the Fed’s stimulus escalation and global programs to at least temporary shift the mood of the masses. This large economic package is not yet full signed off, but the assumptions likely follow the line of a week-end approval. If we were to see it flounder into the weekend, Monday’s open would probably not be pretty. Yet, with this latest, massive move; the next moves on the cheese board look more limited for influence.
There is no doubt that the governments and central banks behind the world’s largest economies can muster further effort to try and beat back the financial gloom should it press in once again. That said, the heft such subsequent iterations would carry among market participants and citizens would likely loose significant traction moving forward. It would perhaps be best if we didn’t have to put sentiment to the test. Alas, the data over the next weeks is going to be constant reminder of a severe recession that will almost certainly sweep over us. This past session, an indicator that once was considered a very low priority among data observers generated surprising levels of interest. The nearly 3.3 million jobless claims filed over the past week offers a timely update of the extreme current. There is much more data of this type and deeper brand ahead of us. Can speculative appetite reinforced by the global stimulus programs hold back the fear that will be nudged by each of these updates?
| Change in | Longs | Shorts | OI |
| Daily | -1% | -5% | -3% |
| Weekly | 25% | -16% | -1% |
Chart of the S&P 500 Overlaid with US Initial Jobless Claims (Monthly)
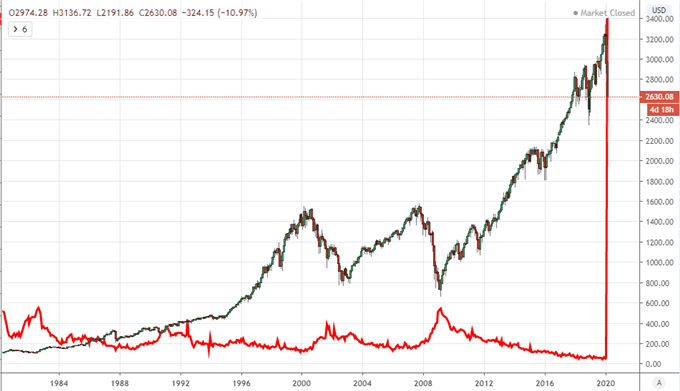
Chart Created on Tradingview Platform
Dollar Posts Biggest Single-Day Rally and Drop in 3.5 Years Within Week
While there remains a serious disturbance in the financial system, there is still a welcome easing from the more extreme distortions in the market. Fed Chairman Jerome Powell was discussing the liquidity and credit troubles we currently face – though he remained adamant that the US economy remained fundamentally sound. Averting some immediate points of escalation, credit rating Fitch held its US sovereign credit rating at AAA with a ‘Stable’ outlook while Treasury Secretary Steve Mnuchin said he would do everything to ensure the markets stayed open.
In response to these efforts to bolster market depth, we have not only seen a speculative bounce take in the more risk-leaning assets, but the more elemental havens are also easing their threat assessments. Growth-leaning risk assets (yields, oil, industrial metals) are showing less enthusiasm to their more heavily speculation determined counterparts, but they have still steadied. On the opposite side of the scale, there remains some measurable pressure behind gold and the Japanese Yen. Yet, the most notable abatement on my radar is presented by the US Dollar. We have seen the benchmark currency revert to its absolute liquidity status during the height of our recent market crisis. To see the Greenback ebb is an encouraging sign. That said, a scenario with the biggest single-day DXY Index rally and the its biggest single-day drop since June 2016 within a week of each other paints the same volatility picture.

Chart of DXY Index with 1-Day Rate of Change (Daily)
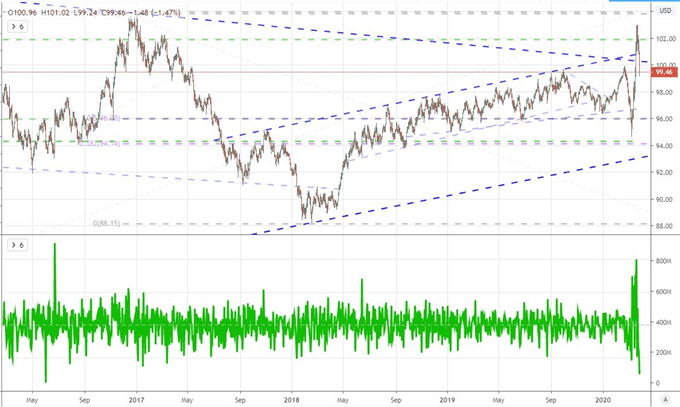
Chart Created on Tradingview Platform
If you want to download my Manic-Crisis calendar, you can find the updated file here.
.


