S&P 500, Dow, Pound Talking Points:
- Dow and S&P 500 futures opened to their biggest gap lower since at least the 9/11 financial shock in 2001
- The Fed escalated its efforts to fight the global fire by announcing stimulus that would target ETFs particularly in high yield fixed income
- Questions of relative value arise with tech-heavy indices, the Euro where stimulus hurdles rose and Gold’s revival as a haven
The Dow and Risk Benchmarks Suffer Another Tough Open for the Week
The start of US markets each week at this stage is a systemic statement on sentiment for the entire financial system. I was watching the open Monday closely, starting with the kick off of the Tokyo session. The picture was a dour one from the start. With a progressively productive slide in sentiment through the Asian and Europe session, we were heading into US trade with clear expectations. Pre-session trade for the Dow registered its biggest gap down on my records while the E-mini S&P 500 notched the worst jump lower since the shellshock that followed the attacks on 9/11 in New York 2001. When markets opened in New York, however, it wasn’t a tumble from open to close. There were a few intraday corrections that managed to tease both hope and fear, which was perhaps the best markets could expect under the circumstances.
| Change in | Longs | Shorts | OI |
| Daily | 7% | -6% | -1% |
| Weekly | -25% | 7% | -8% |
Chart of Dow Jones Industrial Average E-Mini Futures and Gaps (Daily)
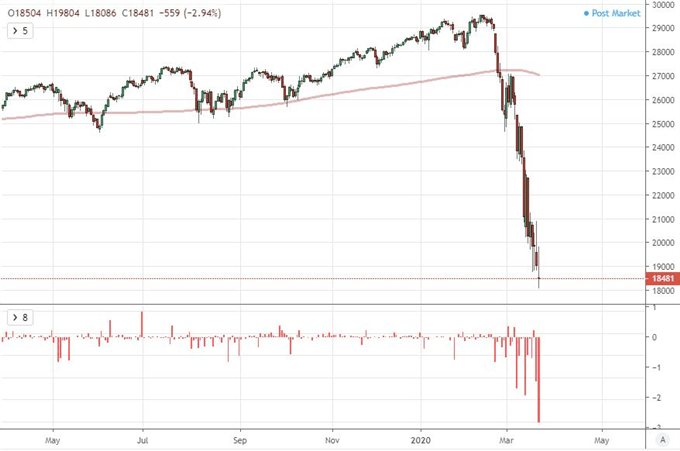
Chart Created on Tradingview Platform


In other corners of the speculative market, risk appetite didn’t come off as being so dire. Equities around globe (the VEU is something of a shortcut) were lower, but the news flow up through their respective sessions may have bought them more time – news of Germany rejecting Euro bounds and the UK PM announcing a country closure came after hours. Meanwhile, emerging market assets, carry trade and growth-oriented assets like crude oil were holding their own. That is not a roaring endorsement of fighting the current with a risk-on exposure, but it is enough light through the cracks to keep back the overwhelming sense of dread that headlines alone may generate.
Chart Search Ranking for ‘Recession’ and ‘Bailout’
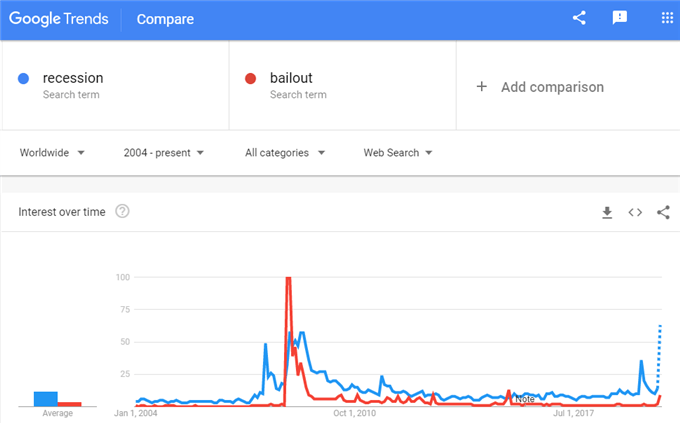
Chart from Google Trends
US Government Fumbles Stimulus While the Fed Escalates Even Further
Around the world, there were further headlines discussing the further measures being taken by policy authorities to staunch the bleeding. However, there were a few critical shortfalls where it counted most. In Europe, the German Economy Minister rejected the notion of euro bonds – though it comes not long after the approval of 750 billion euros in stimulus for the country. Far more important in the grand scheme of things was the failure in Congress to push through a more-than $1 trillion stimulus program. There are points of debate on both sides of this political fracas, but delaying a significant response to an overwhelming financial and economic problem is ultimately a serious systemic risk at this juncture. The IMF warned in an update that a global recession is probable for 2020 (with a recovery in 2021) and that they were willing to deploy all $1 trillion of their lending capacity to fight this crisis. An economic crunch looks to be inevitable, so the question is whether the measures aimed at offsetting will be significant enough.
Chart of US 10-Year to 3-Month Treasury Yield Curve Overlaid with S&P 500 (Weekly)
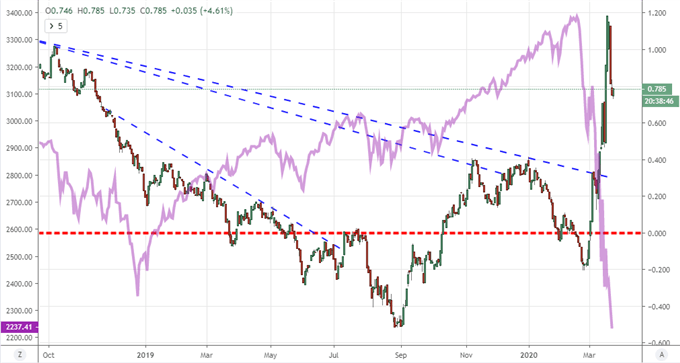
Chart Created on Tradingview Platform
In contrast to the indecision of the US government, the Federal Reserve seems to have a hair trigger for expanding its efforts. Monday, the world’s largest central bank announced that it was expanding its program to buy an unlimited amount of Treasuries and mortgage backed securities. In that program, the group also suggested it would buy ETFs that track credit funds like those for the high-yield fixed income set (HYG and JNK). This is an effort to keep liquidity in the credit market while investors the world over are more wary of risk. To many, this registers as the vaunted ‘QE infinity’, but the ultimate slide through the trading day leaves those hanging hopes on the move with the sense that the effort was ultimately for not. I wouldn’t write the effort off, but it may not sway the speculative masses.
Chart of HYG High Yield ETF Overlaid with Expected Fed Cuts Via Futures in Green (Daily)
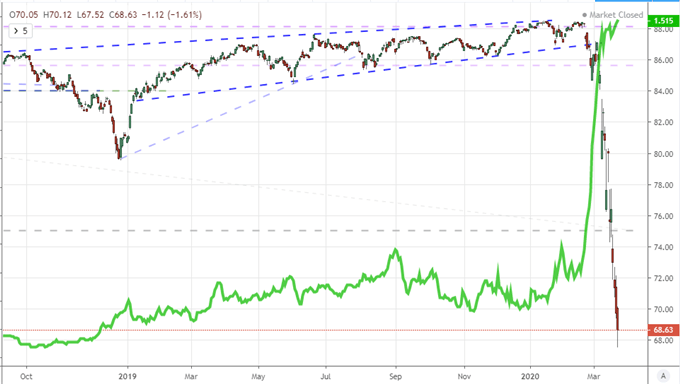
Chart Created on Tradingview Platform
Implications of a Nasdaq, Pound and Gold Divergence
As the more systemic matters of risk trends, central bank commitment and government stimulus work out their influence, there are a few isolated developments that should warrant special attention. In the lament of US equities, there has been a particular disparity in the performance of tech sector shares versus those of other industries. This phenomena is drawing a number of explanations such as the source of revenue and essential nature of online business in modern day, but in general, there is no arguing with performance. The Nasdaq 100 is indeed showing a notable divergence relative to the S&P 500 or Dow. Whether or not the reasoning is sound, the move is hard to miss.
Chart of the Ratio Between the Nasdaq 100 and S&P 500 (Weekly)
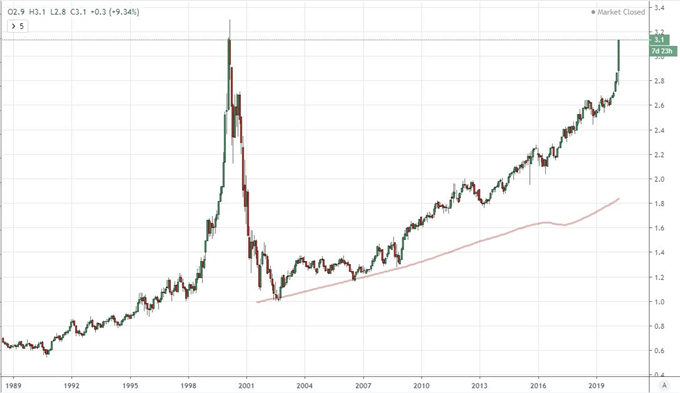
Chart Created on Tradingview Platform
The Pound is another benchmark that may be drawn into its own remarkable performance. After the London market close, Prime Minister Boris Johnson announced that there would be a three-week shutdown of movement in England, with very few exceptions. This is increasingly looking like a necessary move for much the world to throttle the spread of the virus, but that doesn’t mean it won’t come without its economic toll. The performance for both the Sterling and FTSE 100 should be monitored moving forward for how far the markets are looking to weight the issue.
Chart of GBPUSD Overlaid with the FTSE 100 (Daily)
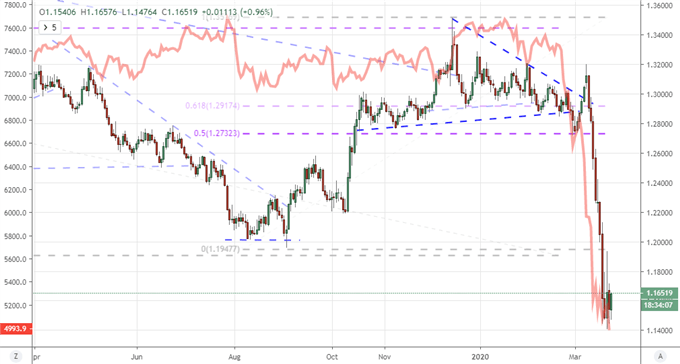
Chart Created on Tradingview Platform
Finally, a market milestone that I’ve been following for guidance on the severity of risk trends, gold, noted an impressive rebound this past session. The precious metal took a beating over the past few weeks as the market looked to unwind exposure that locked up capital – even in havens – to open up liquidity that could be used for covering margins or was simply as far from risk as possible. Keep tabs on this dichotomy between precious metal and primal currency moving forward to add to the evaluation of risk trends.
| Change in | Longs | Shorts | OI |
| Daily | 3% | 0% | 2% |
| Weekly | 9% | -7% | 1% |
Chart of Gold Overlaid with an Equally-Weighted Dollar Index (Weekly)
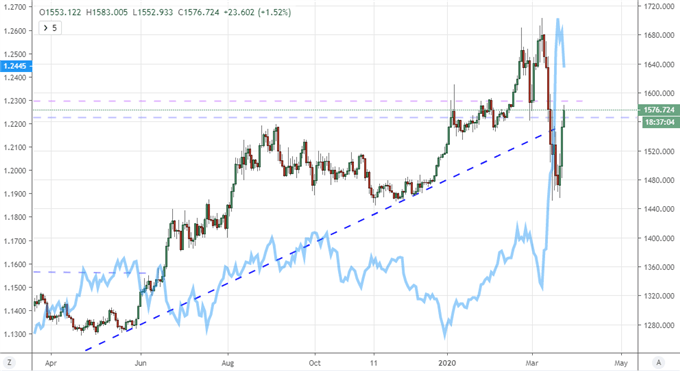
Chart Created on Tradingview Platform
If you want to download my Manic-Crisis calendar, you can find the updated file here.
.


