


S&P 500, Dollar Talking Points:
- The S&P 500 ultimately suffered its worst week’s decline, at -15%, since October 2008 – which was itself a modern day record
- Waves of stimulus and systemic financial support continue to be announced on a daily basis such as UK wage coverage, Fed swap lines and RBA stimulus
- An update from the BIS reported the US Dollar was on one side of 88% of all trades, which suggests its charge holds serious consequence for the world
The Worst Week for US Markets Since the Crisis and Monday’s Open Look Troubled
It was difficult to miss the damage sustained by the global economy and markets this past week. For the latter societal gauge, the US equity markets suffered one of their worst performances over that five-day period on record. In fact, the 15 percent drop for the S&P 500 was the worst loss of altitude for the benchmark since the height of the 2008 financial crisis when Lehman Brothers through the system into a tailspin. For further context, this is also the second worst week in 80 years – the second worst on record for the Dow. The bear market has yet to capitulate and the context of both general market heights and the extent of leverage built up over the past decade means there is significantly more deleveraging that can be worked off. The principal question in my mind is whether we can restore some order to the necessary rebalance?
| Change in | Longs | Shorts | OI |
| Daily | 2% | -6% | -3% |
| Weekly | 17% | -18% | -4% |
Chart of S&P 500 with 1-Week Rate of Change (Weekly)
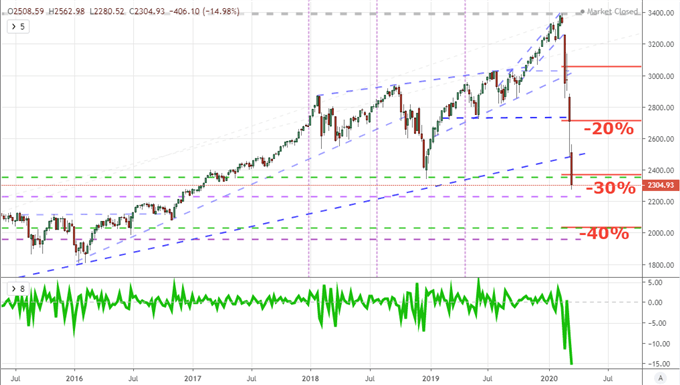
Chart Created on Tradingview Platform
In the bigger picture context of the market, there remains significant excess. Though the S&P 500 and Dow have passed the 30 percent correction mark (from record highs), we are still at stratospheric levels compared to the 2000 and 2006 highs. Furthermore, the dependency on leverage – for markets, governments, central banks, consumers and the business sector – along with the drive behind speculative complacency for the past four years leaves a tangible value gap. While a continued slide in the markets would probably be healthy to a certain extent, the frenetic pace does little more than create instability and threaten the structure of the markets. I will be looking for a throttling next week, but Friday’s close doesn’t suggest a peaceful open. Once again, the week’s open will be important with Asian trading hours and pre-exchange derivatives trading a must-watch. Tracking the progression of sentiment as the day rolls forward is very informative.
| Change in | Longs | Shorts | OI |
| Daily | 8% | 2% | 4% |
| Weekly | 9% | -3% | 2% |
Chart of Dow Jones Industrial Average and Gaps (Weekly)
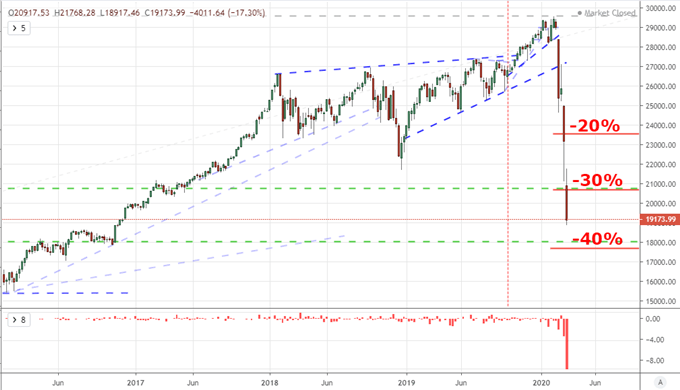
Chart Created on Tradingview Platform
A Barrage of Stimulus and Clear Anticipation of Economic Fallout
The coronavirus is taking a troubling, immediate human toll with those falling ill and thousands dying; but its reach is stretching much further through economic means. In an effort to curb the spread of the contagion, more countries are making the decision to halt the movement of its population and shutter businesses. That is putting many people out of work for the duration of the shelter guidance. What’s more, when the isolation mandate is lifted, those jobs and businesses may not be there for people and consumers to return to – that is unless the world’s policymakers can mount a comparable defense. First, the scale of the impact needs to be measured, both to gain scope for a response as well as gauge the market’s state of sentiment. Amid a range of indicators that will take on a perspective larger than their particular reach, the March PMIs will prove particularly comprehensive while the US jobless claims are sporting severe expectations.
Chart of the Global Manufacturing and Service Sector PMIs (Monthly)
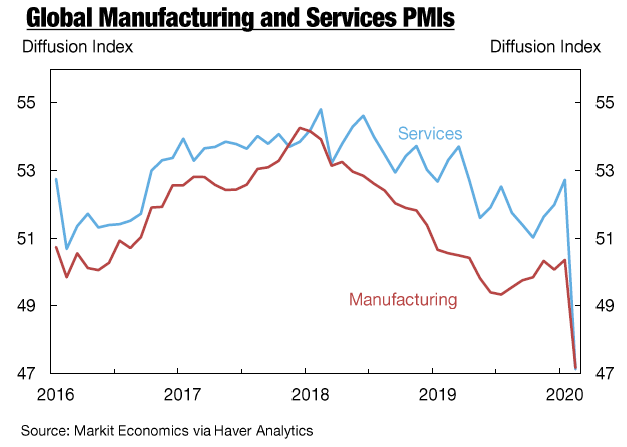
Chart from the New York Fed and Data from Markit Economics
As we await the inevitable drop in economic measures, it is important to remember that the outlook for markets and the economy does not have to collapse progressively under a compounding pessimism. Governments and central banks the world over are taking extraordinary measures to shore up our systems. In fact, there have been so many new programs and policies announced this past week that I have literally had trouble keeping track. That is a good thing. While there is certainly room for criticism, the speed and scale with which authorities are moving to head off collapse is far faster than anything we have seen in modern day – certainly more impressive than the 2008/2009 actions. Just few of the run in updates that we had to close out this past week were: the Fed’s decision to accept municipal debt as collateral on certain operations; the EU Commission its escape clause for budgets; the UK vowing to cover 80 percent of wages for workers effected by the virus (up to 2,500 pound per month) and Switzerland adding another 32 billion francs to its aid package. I expect further waves in the week and weeks ahead. If they can find a way to keep businesses afloat and citizens their jobs, it will dramatically reduce the extent of the pain and the time to recovery.
Google Search Trends for ‘Recession’, ‘Financial Crisis’ and ‘Stimulus’
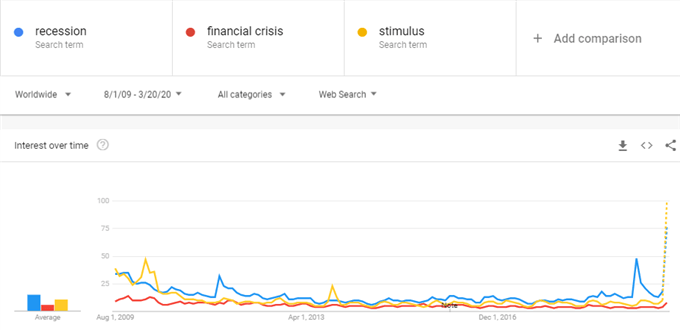
Chart from Google Trends
The Importance of the Dollar as a Gauge of Liquidity
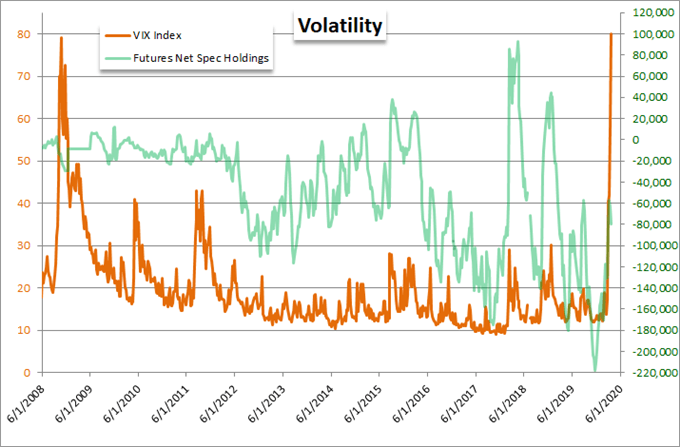
As we monitor the existential battle between economic crush against government salve, we should remember the sensitivity of the markets. There has been a significant withdrawal of speculative exposure but there has been such a deployment of notional and theoretical leverage, that it is not difficult to foresee further sustained unwinding. An orderly retreat is what I’m looking for, but volatility can make that difficult. The average daily swing on the likes of US indices reflects the difficulty in markets. The VIX has pulled back below 80, but it is still hovering in extreme territory. That has consequences. In fact, looking at net speculative futures positioning in VIX futures, there has been a reckless maintenance of a large net short exposure in the market that has taken down at least one player (Ronin Capital in Chicago).
Further at the core of a distorted and hazardous market is the state of liquidity in the system. As global market participants flee assets that are considered to carry risk that they simply aren’t willing to hold, the question of what qualifies as a reliable safe haven draws difficult scrutiny. There are clear issues when it comes to some of the more familiar safety nets like gold and the Japanese Yen. However the surge of funds into government money market mutual funds and tumble in government bond yields suggests the foundations of market depth are being pursued. Yet, that is not totally reassuring when we consider the volatility in Treasuries and their derivatives as well as the charge behind the US Dollar. The Greenback has drawn an incredible rally with enormous moves for EURUSD and GBPUSD but truly incredible heights relative to the most liquid emerging market currencies. This carries serious collateral damage for financing – much less trade – and that raises the probability that this environment of fast adaptation inspires USD intervention.

Graph of Risky Assets to Havens
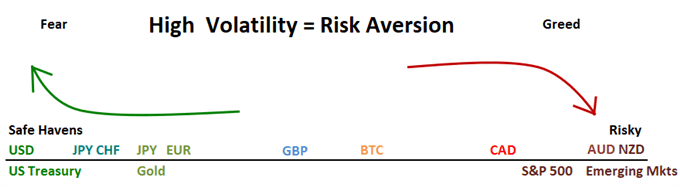
Chart Created by John Kickligher
If you want to download my Manic-Crisis calendar, you can find the updated file here.
.


