
Dollar, Dollar, EURUSD Talking Points:
- The Dow officially tipped into a technical bear market which is defined as a 20 percent drop from relative highs
- Risk aversion was seen widely, but there were also early signs of liquidity strain which could amplify the risk aversion – so know your havens
- As volatility persists and rhetoric starts to take frenzied tones, it is important not to panic. One of the best means to combat panic is a plan
The Dow Enters a Bear Market But Worry Runs Deeper
The major US indices dipped into technical bearish market territory this past session – defined by a 20 percent correction from relative highs. That perhaps isn’t too great a surprise as we have hovered close to that unflattering low water mark for much the week. However, the arrival should still be given the due respect it deserves. Among the major US benchmarks, the S&P 500 didn’t close below the threshold but the supposed blue-chip Dow had. That seems to contradict our expectations for relative safety – at least as far as US indices go – but added pressure from key components like Boeing that are hit particularly hard by the coronavirus, underlying economic issues and/or financial pressure makes for a more troubled standard bearer. Though this is just one of many different ‘risk’ milestones, it is a dangerously prominent one.
Chart of Dow with Rate of Change (Daily)
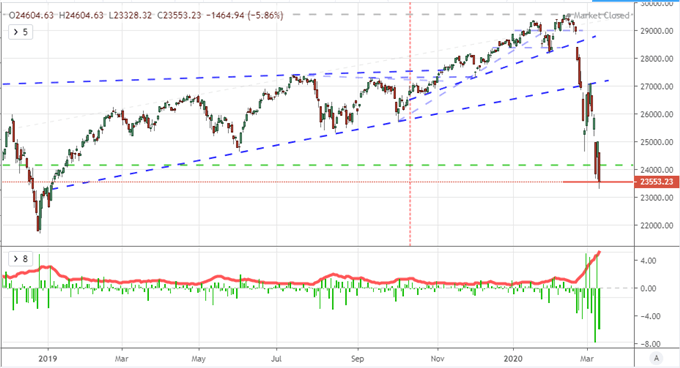
Chart Created on Tradingview Platform
As far as the overview of the market goes, there is important difference between the performance of a certain popular measure and the features of the underlying financial system. If it were just a long-overdue reduction of excessive speculative enthusiasm for this outperforming group (US equities), analysis could lead an investor to better options. However, what we seem to be experience is more of a systemic problem. Speculative-led markets across the world and asset spectrum have been in retreat these past weeks. More worrying are early signs of liquidity risks such as calls for conglomerates to their holdings to tap credit lines, government budgets preparing targeted stimulus and central banks opening up short-term access among others. These are not yet full momentum, but worry alone can trigger panic. We as individuals should do what we can to avoid panicking. That may seem ‘easier said than done’ but it is best combatted with a plan. Know your risks and establish a strategy for existing when conditions simply surpass your particular risk threshold – whether that is technical levels, liquidity levels or fundamentals overview.
Chart of Risk Severity/Intensity
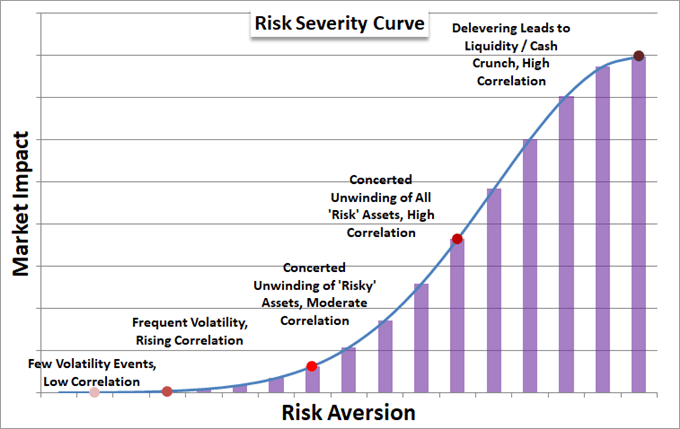
Chart Created by John Kicklighter
Next Step Policy Options to Watch For: ECB, Another Fed Move, Fiscal Efforts
While we can control our own interactions in destiny, we should keep tabs on policy makers to see what they do in a bid to pull us back from a speculative cliff. If we are referring to monetary policy authorities who have been the most forthcoming of the deep-pocketed crisis preventers in the past, there is a high-profile scheduled event ahead in the European Central Bank (ECB) rate decision. With Italy’s moves to institute a country wide travel ban and announce plans to increase its deficit to GDP ratio along with Germany’s warning of a large-scale spread of the coronavirus, expectations are riding high for more accommodation. The real issue here is: what can the group be expected to do? They are already employing negative rates, an active QE program and TLTROs hold over. The greater risk is that the market recognizes the fading effectiveness.
Chart of Perception of Central Bank Effectiveness
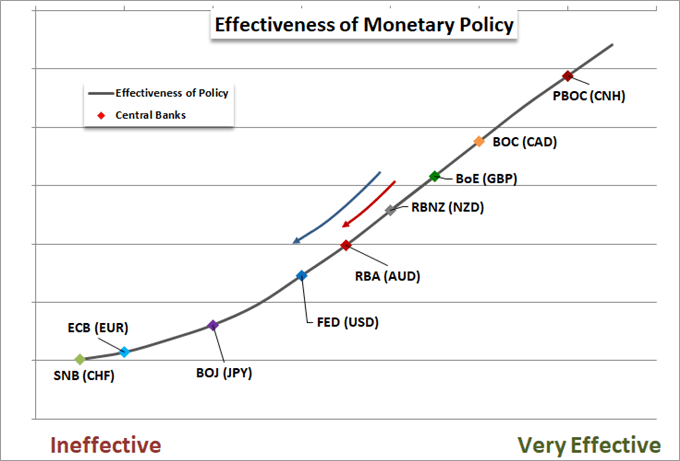
Chart Created by John Kicklighter
In addition to the scheduled ECB response, there is a high risk that another major central bank acts outside of its normal schedule to help halt financial uncertainty. This past session, we had an emergency BOE rate cut that seemed to offer limited local help – much less global. The Fed is still the candidate with the most dry tinder, but it is precious resource that it is likely reticent to expend on a fruitless bid. Aside from monetary policy groups, the most capable groups are governments. The Italian government moved towards fiscal support and the UK announced different measures in its budget to combat coronavirus and the general economic malaise. US President Trump is/was due to brief the nation on the US response which will add to the global picture. Individual efforts will struggle to quell the storm, however, as the risks are perceived as global. A coordinated effort would be difficult to muster in this time of protectionism, but it may be one of the few options that has scale.
Keeping Track of Havens
As I mentioned in previous articles and videos, it is important to keep tabs on the demand for various safe havens. As risk aversion kicks in, those more exposed and speculative-determined assets are more likely to fall under the deleveraging effort regardless of whether they are ‘very’ or ‘moderately’ leaning in that direction. Havens on the other side represent functional need depending on what they are. The comparison between the likes of gold and the US Dollar for example can represent a very critical transition in the mood of the market. Gold is a haven that capitalizes on the fading rate of return in traditional assets and the diminished appeal of traditional currency owing to stimulus. Yet, if that commodity retreats despite fresh easing while the US Dollar rises, it is a sign that liquidation in the pursuit of a ‘cash’ position prevails. That is often a sign of severe risk aversion.
| Change in | Longs | Shorts | OI |
| Daily | 1% | -1% | 0% |
| Weekly | -1% | -7% | -4% |
Chart of DXY Dollar Index Overlaid with XAUUSD Gold Prices (Daily)
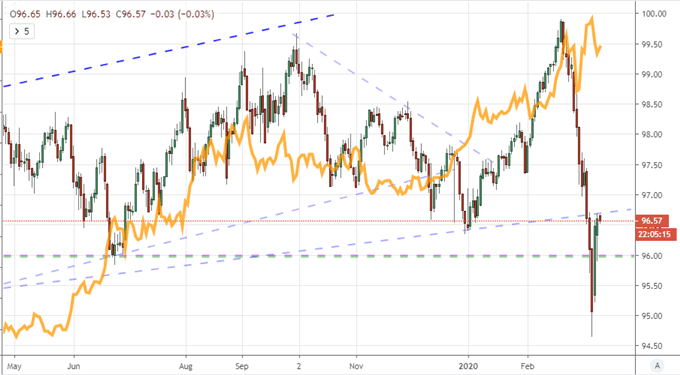
Chart Created on Tradingview Platform
If you want to download my Manic-Crisis calendar, you can find the updated file here.
.