


S&P 500, EURUSD, USDCAD, AUDUSD Talking Points:
- Risk trends put in for a rebound Wednesday with the S&P 500 and US indices leading the way with the most aggressive rallies
- Following the Fed’s emergency 50bp cut, the BOC put in for its own half-point move while US services suited the default over Asian growth figures
- Underlying conditions remain the most important feature of our trading landscape with volatility and the cumulative systemic issues prevailing
Sustained Volatility Conditions that Below A Bounce in Risk
After the dramatic swing in speculative markets and the Federal Reserve’s emergency rate cut through the opening 48 hours of the trading week, it should come as little surprise that we would see a moderation through this past session. There was indeed a broad rebound in risk-leaning assets and tempering of the volatility measures that derive from some of those benchmarks. However, we are far from the temperate conditions of previous months that had set the stage for more dependable conditions of stability. Among the speculative benchmarks I refer to for my sense of ‘risk trends’, the US indices enjoyed the largest relative rallies. That is fitting given the intensity of their tumble these past weeks. The S&P 500 put in for a bullish gap that finds unflattering historical reference to a jump in October 2018 that ultimately failed to dissuade the fourth quarter collapse during that period. Nevertheless, there was follow through during the US session that earned at least a sense of relief from pommeled bulls.
| Change in | Longs | Shorts | OI |
| Daily | 1% | -6% | -3% |
| Weekly | 32% | -23% | -4% |
Chart of S&P 500 with Gaps (Daily)
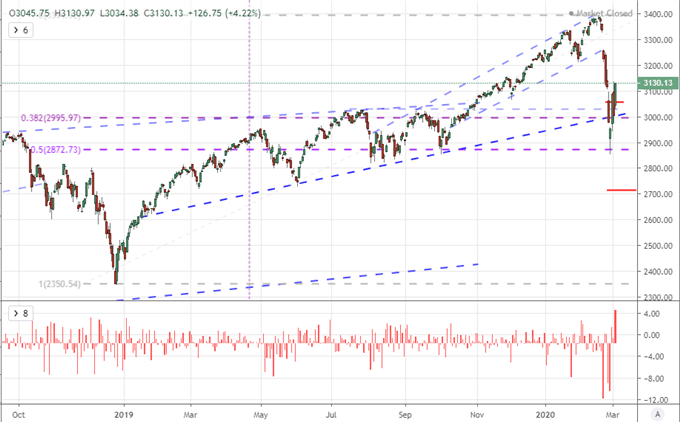
Chart Created on Tradingview Platform
Whether risk-tolerant traders chasing opportunism or beleaguered investors attempting to dollar cost average, there will be a large component of the crowd looking to take advantage of the nascent recovery. Yet, before we are swept into the ill-fated nascent recovery, it is important to appreciate that volatility remains exceptionally high by historical standards – if not constantly pushing the extreme highs established during previous years’ bouts of duress. Volatility is not a favorable lever, though many treat it as a natural booster to their views on the market. While this distortion of the market’s tempo can accelerate market swings, it also raises the risk of sudden and unexpected reversals in direction. In other words, volatility is risk. Reverting to the complacency-with-a-bullish-bias of previous years is perhaps one of the most imprudent approaches to the market that one could default to at the moment.
Chart of VIX and Other Asset Volatility Indices (Daily)
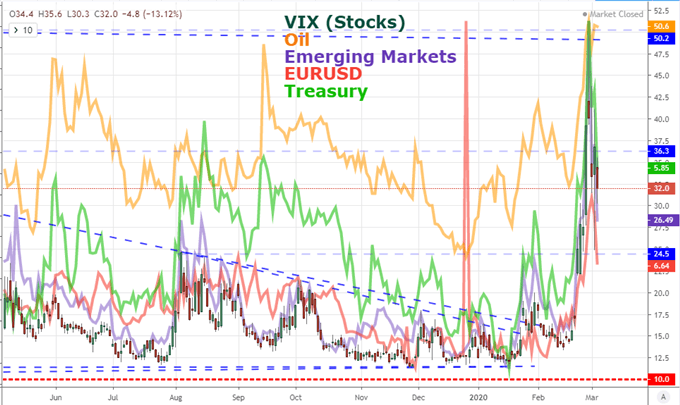
Chart Created on Tradingview Platform
EURUSD’s Hold at Resistance Checks Standard Analytical Boxes but Not Systemic Issues
While risk trends work out their commitment to a long-enduring sense of complacency as fissures of uncertainty present so clearly, there are some remarkable fundamental developments in the financial system that don’t align so neatly to risk trends. The Dollar’s performance is one such instance. The benchmark currency put in for only its second advance in nine trading days this past session. This wasn’t a haven bid as the Greenback seems to have positioned itself as an extreme liquidity currency to tempt that demand to the surface. Instead, it seems the relative aspects of performance that seemed to cater to interest. After the Fed’s emergency half-percent cut, the markets are pricing in further easing through the year. The yield advantage is a hollow support. That said, in a tepid returns environment, relative growth is a more provocative interest. Though underappreciated on the day, the ISM Service sector report for February unexpectedly charged higher to 57.3. The helps quiet the rising tide of recession fear of late.
Chart of S&P 500 with ISM Service and Manufacturing Activity (Monthly)
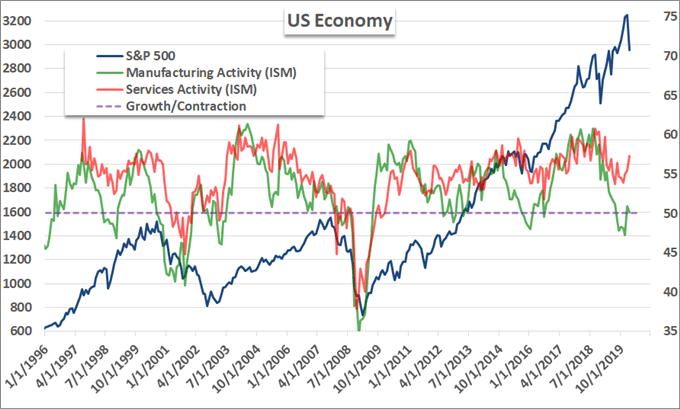
Chart Created by John Kicklighter with Data from Bloomberg Terminal
Perhaps the best alignment of circumstance in the recent upheaval was the convergence of considerations for EURUSD. As the collapse mentality eased in sentiment, this atypical speculative pair saw the endemic pressure taper. On the technical side, the benchmark pair had a trend channel resistance to observe just around 1.1200 that stretched back over a year, but astute technicians would have made note of the 61.8 percent Fib of the historical range in the same vicinity. Fundamentally, the ISM data out of the US was a contrast to the warnings of exposure issued by the EU and credit rating agency Standard & Poor’s whom warned a recession may be in store should coronavirus troubles build.
| Change in | Longs | Shorts | OI |
| Daily | 2% | -12% | -3% |
| Weekly | -4% | 10% | 1% |
Chart of EURUSD with the 5-Day ATR and ROC (Daily)
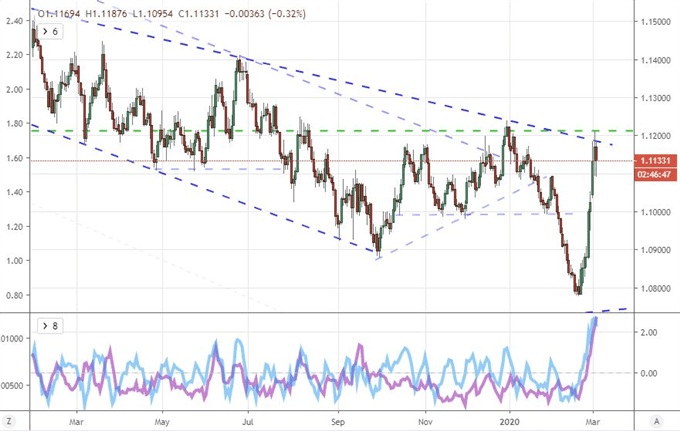
Chart Created on Tradingview Platform
Australian and Canadian Dollar’s Defy Event Risk, Brazilian Real Ignores GDP
In other news, the Australian Dollar has acted to defy its fundamental oppression as of late. When the Chinese PMI figures hit over the weekend, the currency reflected the impact of a country with strong economic ties to a beleaguered epicenter for trade wars and coronavirus. That said, the RBA rate cut didn’t disadvantage as the 25bp easing was relative controlled and expected compared to the likes of the Fed. The Aussie Dollar has been heavily deflated these past months and years, so we may be reaching levels whereby further bearish headlines may struggle for traction. Yet, any fresh Chinese problems ahead are unlikely to maintain the firebreak with AUD.
More surprising than even the Aussie currency this past session was the Canadian Dollar’s response to the Bank of Canada (BOC) 50 basis point cut. The easing was expected while the severity of the move was not. Yet, with its neighbor cutting just the day before in its emergency session, the chances of a strong move rose significantly in swaps markets. There is still considerable ground for the Loonie to slip should the dovish sentiment prevailing the world sweep into Canada.
Chart of Monetary Policy Perception of the World’s Largest Central Banks
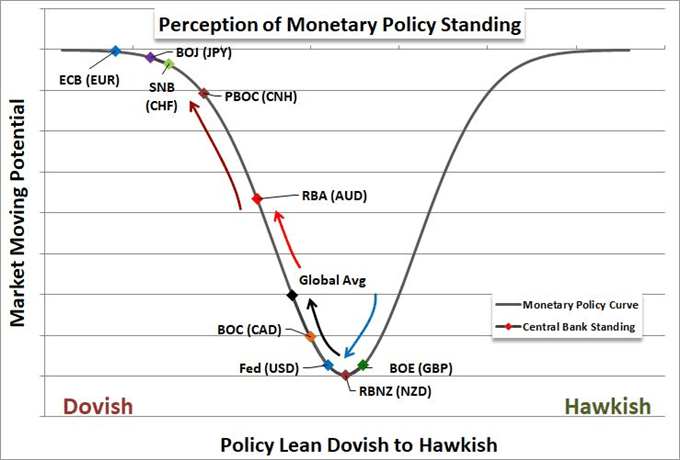
Chart Created by John Kicklighter
While there were a few other interesting highlights around the market and those with potential ahead, one stand out for me was the Brazilian Real. Despite a steadfast 0.5 percent quarterly expansion in 4Q with a 1.7 percent pace year-over-year, USDBRL extended its charge higher to a record high. Brazil is a large country, but my real interest here is that the country’s authorities have attempted to artificially boost their currency to arrest its collapse to record highs…to no avail. Could this be a step into more extreme policy at the fringes as the core groups fall into traditional monetary policy?
Chart of USDBRL with 50-Day Moving Average and Disparity to Spot (Daily)
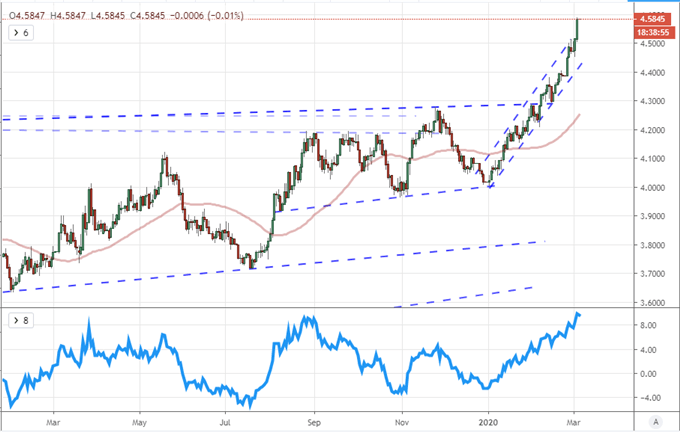
Chart Created on Tradingview Platform
If you want to download my Manic-Crisis calendar, you can find the updated file here.
.


