


S&P 500, Yen, Treasuries, Gold Talking Points:
- The risk aversion wave continued this past session, registering over 4 percent losses for the Dow and S&P 500, drawing comparison to GFC
- There remains a disparity in tempo among risk-leaning assets, but the gravity of fear is starting to spill over to other markets
- As deleveraging in risk assets intensifies, there has been a notable deviation from the Dollar's normal safe haven response
Surveying the Damage After Liquidity Drains
We have closed out both the week and the month Friday to exceptional readings of speculative pain. While some of the most risk-tolerant or committed bulls may have found assurance in the modest bounce to end the session, the cumulative pain of the entire week maintains a perspective of instability and fear. Amid a few prominent gaps (Monday, Thursday and Friday), the S&P 500 suffered a seven consecutive day tumble which was the longest bloodletting for the benchmark since November 2016 heading into the Presidential election. In terms of pace, the week alone for the SPX was the worst showing since the Great Financial Crisis back in 2008. The intensity of bearish pressure was so great in fact, that the Dow would also register its worth month in February since that same dire period more than 11 years ago.
| Change in | Longs | Shorts | OI |
| Daily | -3% | -3% | -3% |
| Weekly | -5% | -6% | -6% |
Chart of S&P 500 with Indications of 10% and 20% Correction (Weekly)
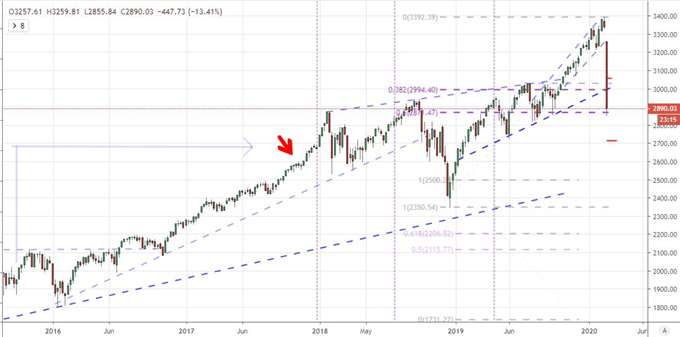
Chart Created on Tradingview Platform
There are a number of ways to qualify that the current slump is more troubling than some of the other volatility events of past years that go beyond the mere statistics of individual pacesetters. The intensity of risk aversion cannot be downplayed, but the breadth of the deleveraging in the form of high correlation among risk-leaning assets is perhaps just as important. There have been situations in the past were a regional pain has led to a sharp and/or isolated move. Yet, when the drive depends on a very specific aspect in the fundamental realm, the fear can pass more quickly as the issue is addressed or the market acclimatizes. When the issue is sentiment itself which is hard to quantify and certainly not readily soothed with an action, the threat of a sustained tumble is significantly higher. In addition to noticeable declines across the risk spectrum, there was also an unmistakable ‘liquidity’ behind the effort. Volume usually picks up on heavy selling days, but that is temporary. What we have registered is liquidity consistent enough to override the ‘flash in a pain’ circumstances. Remarkably, the SPY ETF registered the first $100 billion notional turnover day Friday.
Chart of Risk Asset Performance Benchmarked to Feb 1, 2019 (Daily)
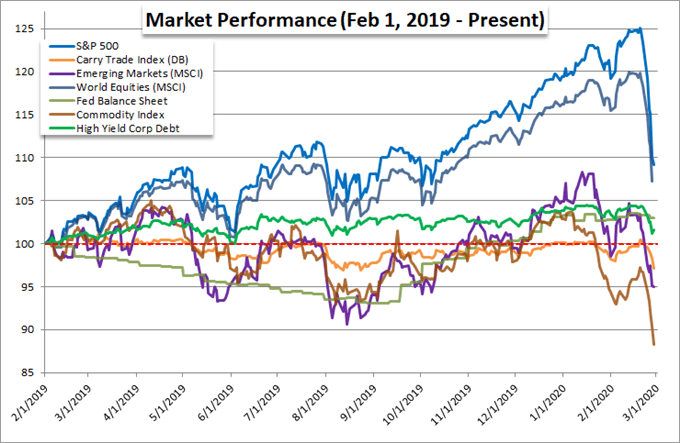
Chart Created by John Kicklighter with Data from Bloomberg Terminal
Weekend Vigil for Relief and Anticipation for Monday’s Open
As we head into the weekend, there remains a serious disquiet among market participants – particularly those that did not make the effort to de-risk before the Friday close. Despite the significant tumble through this past week, the market is still far from what traditional textbooks would deem reasonable value whether referencing yield to volatility, earnings forecasts, economic potential or other ‘mundane’ measures. If speculative appetite does not hold its own, there is a long way to fall before the deep-pocket and stoic behemoths of the financial system deign to return to the market and take on risk.
Twitter Poll of Monday Market Open
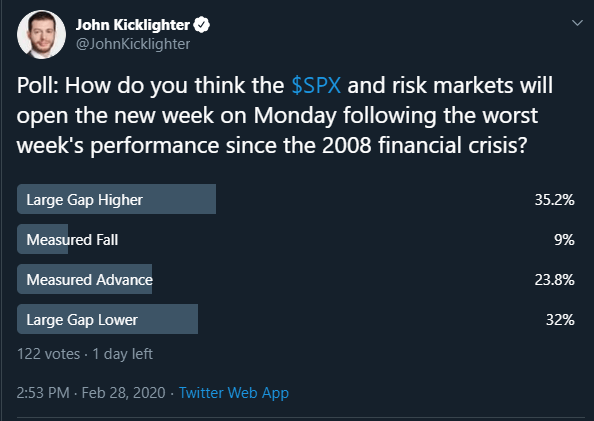
Poll from @JohnKicklighter Twitter Handle
What am I looking for over the weekend? Statements of action from one of the standard sources of bailout during similar periods of tumult in the past: central bank/s or government/s. The expectation that the world’s largest monetary policy authorities will step up is almost a given considering their ubiquity over the past decade. The problem here is that there isn’t much more room for them to operate. The ECB and BOJ are sporting essentially negative rates while they drive ahead full-speed with stimulus. The market is pricing in 92 basis points worth of rate cuts through year end according to Fed Fund futures as they do have a little room to move, but not much. Further, the Fed is already active in buying Treasuries to boost its balance sheet, just in shorter duration. If the world’s central banks are going to sway confidence, they may need to vow a concert effort to show a greater influence than their individual abilities can afford.
Chart of S&P 500 with Implied Fed Rate Cuts Through Year End from Futures (Daily)
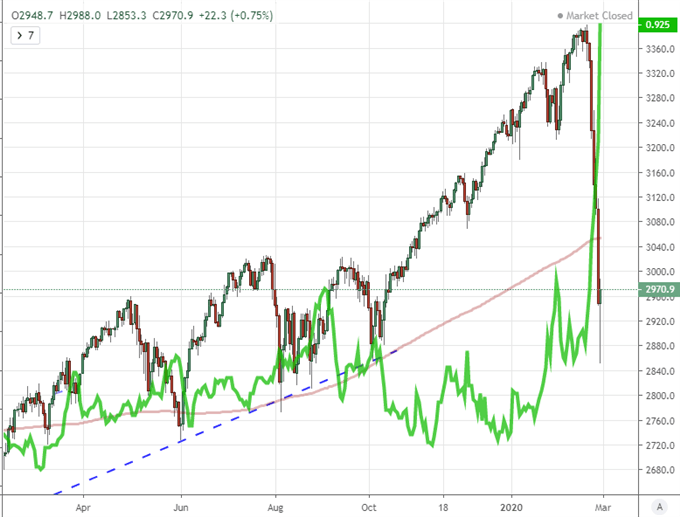
Chart Created on Tradingview Platform
The greater capacity for action comes from the world’s governments. Though public debt is at extremely high levels for most – records for some – there is still more capacity for stimulus. Infrastructure spending has been a common refrain in the US and elsewhere. The White House attempted to soothe fears on Friday, but they fell well short of the market – and even encouraged serious risk taking with the Chief Economic Advisor Larry Kudlow suggesting investors to ‘buy the dip’. Moves aimed at devaluing currency or raising tariffs would not only fall short of inspiring growth, it would likely exacerbate problems. The best potential is a coordinated and proactive stimulus vow, but there has been little-to-no sign of harmonizing among the querulous major governments. Nevertheless, keep an eye out.
Emphasis on Events and Themes Shifts While S&P 500, Yen and Gold Act as Key Indicators
As we move forward, themes have the capacity to add to worries, but they are unlikely to generate true enthusiasm. Fears over a slow growth turning into a recession, trade wars returning or converting into a currency war and central bank policy failing to support stretched markets carries estimable weight. There isn’t an equal, opposite measure to these issues, only the status quo. Discrete event risk is a similar situation, just with far smaller innate scope. Therefore, while the docket is heavy and anticipation high, I will look to mood before I dive into scenarios for the fundamentals.
Meanwhile, there are a number of benchmarks that I will refer to in the week ahead as a baseline for that same sentiment. The S&P 500 has become the spokesperson for risk appetite – both favorable and unfavorable – so I will mark its progress with great interest. The Japanese Yen will present something with a little more nuance. Carry trade has never really garnered good traction in the recovery phase, so it is not particularly reactive to small wavers in sentiment. Its capitulation comes with something closer to systemic upheaval. Therefore, the slide from the crosses this past week added serious depth to the market analysis. Then there is gold as a haven with a bent for financial stability concern. The commodity has climbed consistently over the months despite a fairly consistent charge for equities. That has added to may skepticism. And yet, with the severe risk aversion of the past week, the metal slipped. Is this a shift in the asset’s role in the market? I don’t believe so. This is more likely a need for capital as margin calls swell. Its haven properties are more likely to kick back in.
| Change in | Longs | Shorts | OI |
| Daily | 7% | 0% | 1% |
| Weekly | 1% | 3% | 2% |
Chart of an Equally-Weighted Yen Index with 1-Day Rate of Change (Daily)
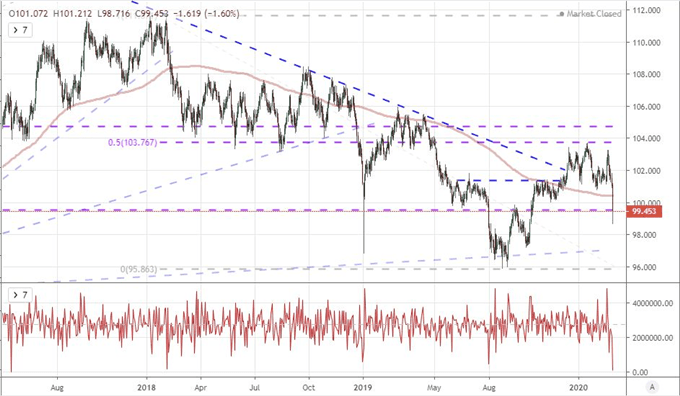
Chart Created on Tradingview Platform
If you want to download my Manic-Crisis calendar, you can find the updated file here.
.


