


USDJPY, EURUSD, AUDUSD, Nasdaq Talking Points:
- In a mirror to Wednesday's gap higher, many risk benchmarks gapped lower this past session; and Nasdaq's lead seems to paint the picture
- Where sentiment struggles for clear traction, the Dollar's climb has extended to fresh multi-year highs
- EURUSD earned Dollar attention first, USDJPY extended Wednesday's multi-year wedge breakout, AUDUSD broke Thursday and GBPUSD stands ready
The Dollar Rally Raises the Breakout Tally Among the Majors
Many of the risk-based markets that I follow routinely maintain a lack of conviction that has extended ranges like the that of the EEM ETF or even throttle what seems otherwise a clear course like the US indices. Yet, one benchmark seems to have found a tempo of productive trend: the Dollar. We have been tracking the Greenback’s climb these past weeks, and its performance was sustained through Thursday’s trading session. The trade-weighted DXY Dollar Index drove to fresh highs not seen since May 2017. This reflects directly on the EURUSD which accounts for the bulk of that index’s weighting with lows with a similar historical precedence. Yet, the pace between the aggregate and single most liquid pair was notably different this past session.
Chart of DXY Overlaid with Inverted EURUSD (Weekly)
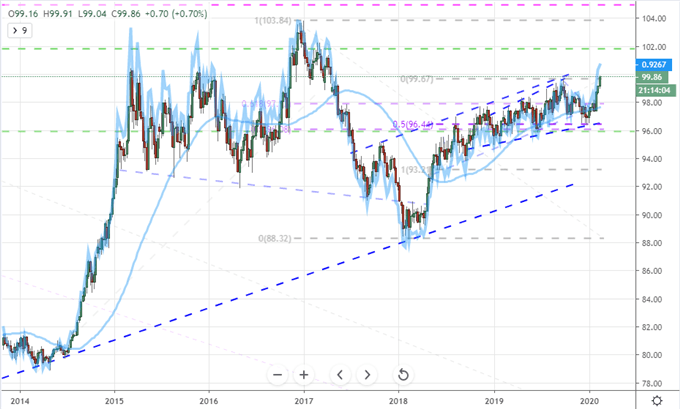
Chart Created on Tradingview Platform
A charge from the Dollar across the board is far more impressive in my book than just an outsized move from the prominent pair that uses liquidity to leverage amplitude. In fact, looking to an equally-weighted Euro index, the second most liquid currency seems to have actually regained some traction. So, the USD’s progress is genuinely intrinsic rather than coincidental. USDJPY was the key follow on technically in Wednesday’s session with the bullish break from a multi-year wedge. A second day of follow through brings the pair to the midpoint of the past six years’ range. Just this past session, AUDUSD has earned a bearish break through range support to lows stretching back to early 2009. If the momentum continues, we may find other Dollar-based pairs like the GBPUSD pull through with subsequent breaks. The Cable looks to be sitting on a head-and-shoulders pattern.
| Change in | Longs | Shorts | OI |
| Daily | -8% | -4% | -7% |
| Weekly | -3% | 49% | 4% |
Chart of AUDUSD with 200-Day Moving Average (Daily)
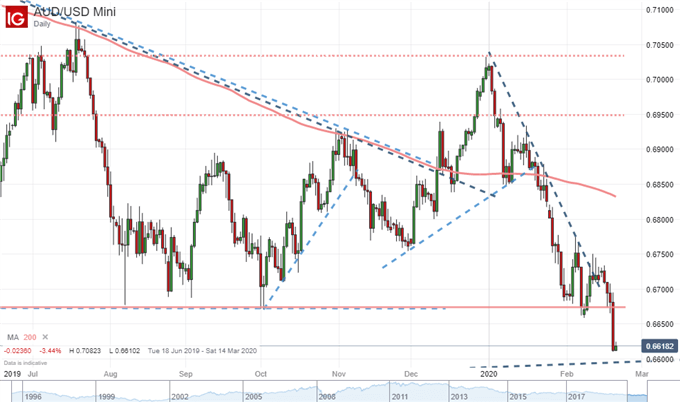
Chart Created with IG Trading Platform
Coronavirus Fears Run Into Tangible Growth Figures and Trade Wars Risks
Global markets with key assets and themes often carry messy consequences with significant change. From the Dollar’s charge, could see monetary policy implications. Beyond the ire of US President Donald Trump’s regular critique of the Federal Reserve, we have seen USDBRL drive to a fresh record high. Last week, the Brazilian central bank attempted to bolster its currency, which clearly did not work as intended. Another byproduct of the Dollar rally is the push in USDCNH back above 7.0500. This is a level that has previously been associated as a switch for designating a currency manipulator. That is strain on the sensitive trade armistice between these two countries. Will the White House and Trade Rep’s office make a case out of this progress as evidence of unfair trade advantage? The Phase One trade deal is already under pressure from the coronavirus, will this be the failed pressure relief valve?
Chart of USDCNH with 100-Day and 200-Day Moving Averages (Daily)
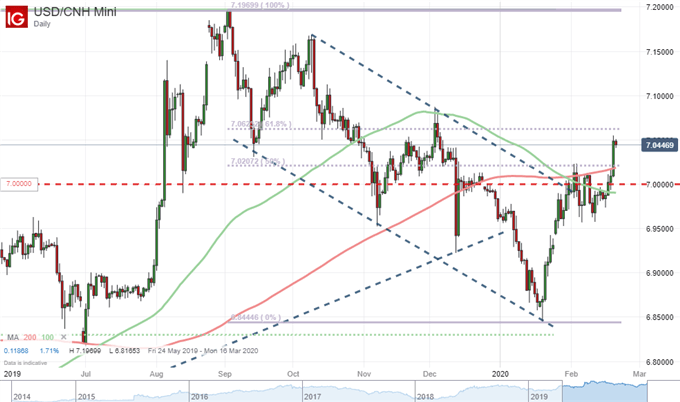
Chart Created with IG Trading Platform
The spread of the COVID-19 virus is a more thematically complicating factor for the broader financial markets. Strong speculative reaction to the sheer amount of headlines related to the contagion has receded these past few weeks. However, appreciation of the tangible economic fallout from this ongoing issue continues to gain headline traction. Following the WHO’s warnings, the FOMC minutes marked an economic warning even though the meeting wrapped at the end of January, Apple’s revenue projections were a top corporate warning and now banks are suggesting the markets are at risk for underpricing the threat. That said, the genuine economic fallout from this external pressure can prove another systemic threat to borrowed time on enthusiasm. Will we start to see the true impact in current data? The February PMIs are due for Asia, Europe and US Friday. That comprehensive and timely update on global economic health may show what many have feared but put off…or it can ward off concerns yet again.
Flippancy in Risk Assets: Gaps and Tails
With global growth on the line, a waver in speculative sentiment is a reasonable concern. This past session, there was a check lower in risk-leaning assets measured mostly in gap rather than active follow through. The Nasdaq was Wednesday’s standout for the budding risk appetite charge Wednesday, so it was reasonable to start there for a superficial risk reading. The same index offered a gap lower and traded lower through the first half of the session, but a recovery effort through the close left a noticeable tail to leave traders with considerable sense of uncertainty and conflicted commitment. Global stocks are showing less progress than the US markets, emerging markets and junk representatives are generally in ranges. Only the carry trade – Yen crosses – is showing even the semblance of progress, and that is still too fledgling to put any conviction behind.
| Change in | Longs | Shorts | OI |
| Daily | -5% | 0% | -3% |
| Weekly | 23% | -14% | 1% |
Chart of Dow with 20-Day, 50-Day and 100-Day Moving Average (Daily)
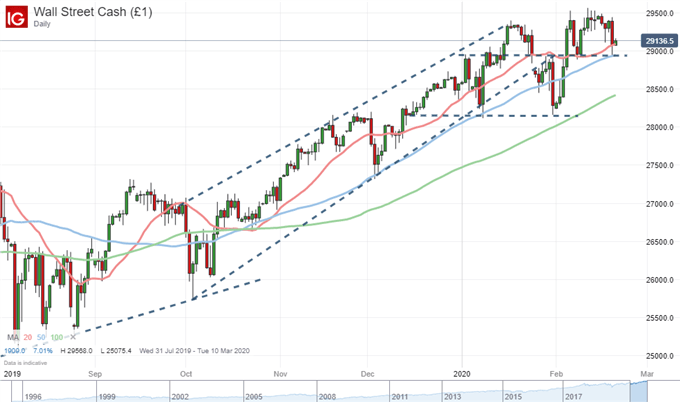
Chart Created with IG Trading Platform
If you want to download my Manic-Crisis calendar, you can find the updated file here.
.


