


S&P 500, Dollar, Dow Talking Points:
- S&P 500 led top US indices to a fourth consecutive gap higher - pushing record highs, carrying other risk assets and still scrutinized
- China's Finance Ministry announced it would halve tariffs on $75 billion in US imports in a reciprocal move that ease a flexibility request
- Top event risk to end the week is the US-based NFPs, but the theme I am watching most closely is the state of growth expectations
Establishing the Quality of Risk Trends Via S&P 500 Gaps
Risk appetite continued to run through this past session with a bid showing through in US indices alongside a generally positive course for the breadth of sentiment-leaning assets. I prefer to establish a systemic overview of bullish/bearish sentiment via a correlation of generally dissimilar asset types that broadly align most often when there is a groundswell of greed of fear. The general bullish lean was present in US and global indices, emerging market assets, high-yield assets, carry and even some of the recently-divergent commodities. That said, the week’s peak tempo and correlation seemed to be flagging as a ‘relief rally’ perspective starts to make the transition into a determined fundamental evaluation. Relief from the concern related to the coronavirus is one thing. Seeing higher returns and more robust to justify a sustained climb – particular record highs in US equities – is another matter entirely.
Chart of Risk Sensitive Assets Benchmarked to Feb 1, 2019 (Daily)
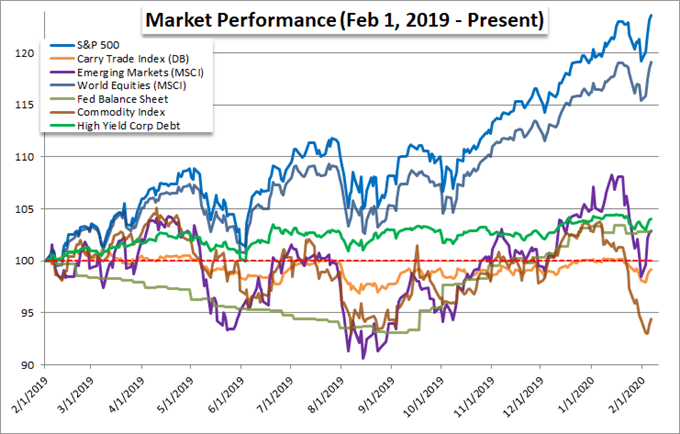
Chart Created by John Kicklighter with Data from Bloomberg Terminal
Once again, an important check on enthusiasm for value-stretched risk appetite comes from the benchmark US indices. The S&P 500 and Dow put in for a fourth consecutive gap higher on the open Thursday. For both, that would push us into the stratosphere of record highs. The 10 trading days since the last record high for the S&P 500 was the same count as the period through December 12th. There haven’t been many lasting segues from the overriding bull trend over these past four months. And yet, the rally from this top performing asset class is itself facing elements of uncertainty. While Wednesday found some footing for follow through after the gap, there has been rather little progress made when the local markets were actually open. For both the indices Thursday, the candles we were left were definitely dojis and could qualify as ‘hanging men’. That alone doesn’t doom the climb, but it does suggest there is hesitation to this otherwise impressive climb.
Chart of S&P 500 with Daily Gaps (Daily)
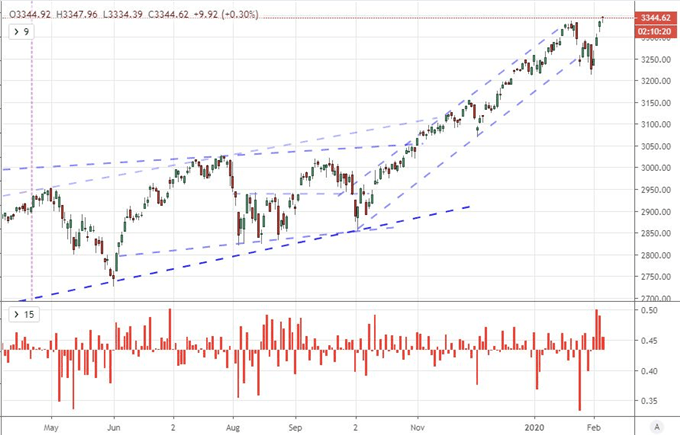
Chart Created with TradingView
NFPs is Top Event Risk and USDJPY Faces the Most Potent Scenario
In terms of influential event risk this past session, there were noteworthy highlights. The poor showing in a run of Australian data and the sharp drop in German factory orders speaks to a poor update on economic activity. While there was a measurable response from the Australian Dollar and Euro, the potency pales in comparison to what is traditionally expected from the US employment data. The monthly change in NFPs (nonfarm payrolls) is perhaps one of the most significant market movers for the US Dollar through history. Yet, the potential in this report is likely skewed. With five years of net additions to the payrolls and a five decade low in the jobless rate, leveraging enthusiasm is difficult even with a default bullish bias. Alternatively, a significant shortfall can both weigh on risk trends and further rate cut speculation for the Dollar. That would be an interesting scenario for the likes of USDJPY at a multi-year congestion pattern top.
| Change in | Longs | Shorts | OI |
| Daily | 5% | 0% | 1% |
| Weekly | 2% | 2% | 2% |
Chart of USDJPY with 200-Day Moving Average (Daily)
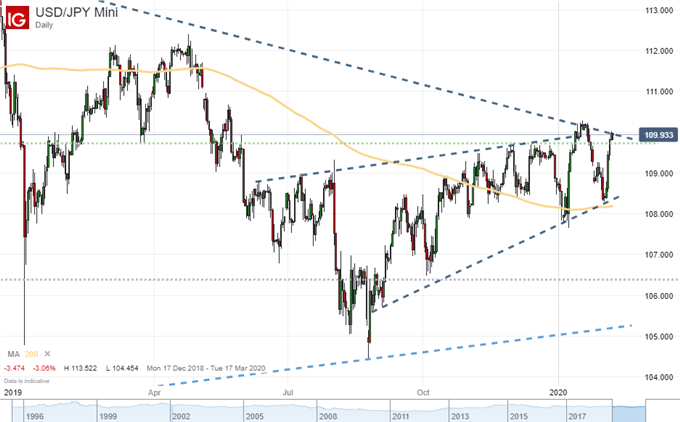
Chart Created with IG Trading Platform
While the US employment stats will draw our attention over the final 24 hours of trade this week, the focus this past session was on something more thematic: the general state of global growth. With a favorable bearing on risk trends, the perspective was seemingly one of optimism, a view supported by the reports that the Chinese Finance Ministry was prepared to halve the tariff rates on $75 billion in US imports come February 14th as a response to the reciprocal efforts to deescalate world’s most costly trade war. This effort may help to soften the White House to requests from China to offer flexibility on the Phase 1 trade deal as the country fights the coronavirus. AUDUSD seems to show limited enthusiasm for the efforts…and the ebb in virus headlines.
Chart of AUDUSD with 100-Day Moving Average (Daily)
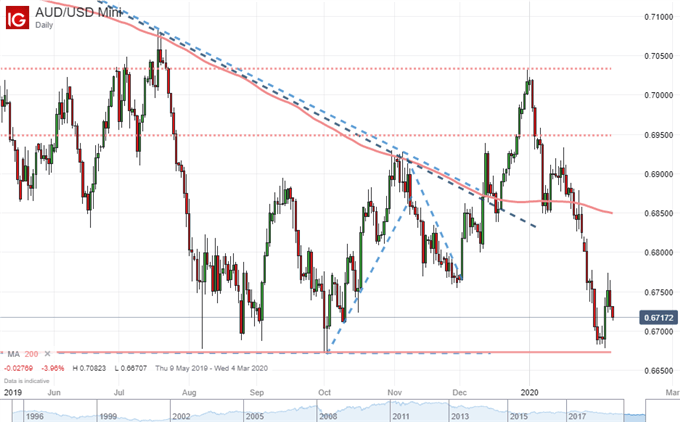
Chart Created with IG Trading Platform
Sentiment and Themes to Usher US Into the Next Week
In the week ahead, traders should not forget the toll that the coronavirus has exacted in volatility over the past few weeks. Market-based fear over the spread of the virus seems to have subsided significantly but the growth in cases certainly has not. In the familiar routine of acclimation, it would seem that complacency is evolving to account for this familiar headline moving forward, but market participants would do well not to totally write off its potential. Whether or not a troubling headline sinks the market seems to be more a function of the underlying bias than the actual material of the news itself. That baseline is my principal focus at the moment.
Looking further into next week, the hierarchy of systemic fundamental themes would seem to put growth at the top of the list for immediate concern. Trade wars have stirred with the request of flexibility and the preparations for tariff reductions but the market seems to consider this a more establish path of de-escalation. Monetary policy is another matter, but the curbs on effectiveness for extreme easing are unlikely to register for a market that is unmistakably dependent on the external support. Rate implications from data like the NFPs and direct surprises from lower-profile currencies like the Brazilian Real after its unexpected hold are unlikely to register on a grander scale. This leads my attention to more traditional growth concerns. There are lingering recession risks from measures like the US Treasury yield curve, high profile updates from the likes of UK and Eurozone 4Q GDP as well as more ancillary updates from the likes of NFIB US small business sentiment and UofM consumer confidence. Presence of event risk is not a guarantee to market movement, but it is a risk.

Chart of US 10-Year to 3-Month Treasury Yield Curve to S&P 500 with 60-Day Correlation (Daily)
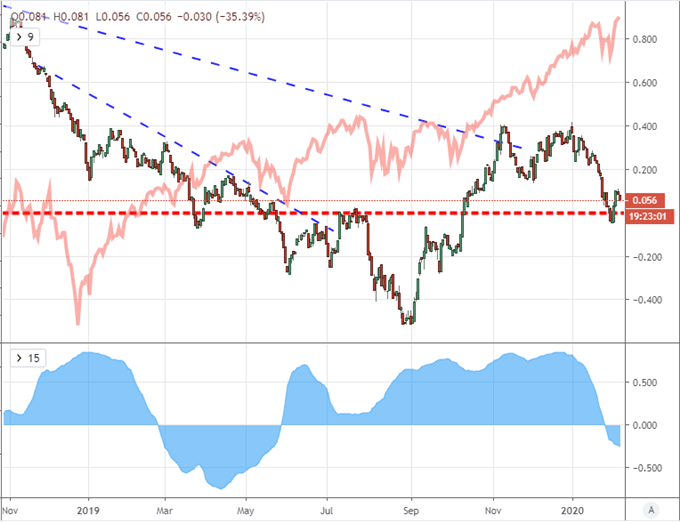
Chart Created with TradingView
If you want to download my Manic-Crisis calendar, you can find the updated file here.
.


