


Dow, VIX, AUDUSD Talking Points:
- Risk aversion was pervasive Friday with the blue-chip risk leading Dow marking a high-profile technical breakdown
- The fundamental theme most referenced as the market retreats is the spread of the Wuhan China coronavirus which does pose economic risk
- Health of the global economy can prove a more tangible threat in the week ahead, but monetary policy and trade carry virus exposure
Risk Aversion Ends the Week, How Will the Next Open?
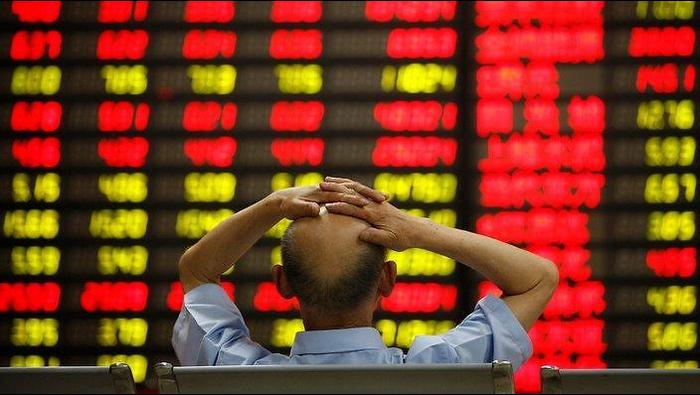
There was an unmistakable swoon in risk-leaning assets to close this past week. This is troublingly familiar given we had just such a waver through the close of the previous week and founded on the same fundamental headlines: the spread of the coronavirus that originated in Wuhan China. As troubling as the headlines may be, sentiment is fickle over what it chooses to show serious concern. We have seen previous bouts of tangible fear around recession threats this past August, trade war escalations throughout the past two years and concern for monetary policy miscues in the Fed’s transition generate seismic rifts only to later be downplayed by a market consistently returning to the compulsion of FOMO. Sentiment can ride out many threats, but eventually it will be overwhelmed by the practicalities of the market. The question is whether we have hit that tipping point. It’s early to make that call in my view, but there are some important technical milestones being tripped that significantly raises the risk. While I usually focus on the S&P 500 among the leading US indices, the Dow was acting the holdout among its peers with the high profile technicals still intact for much of this past week. That changed though Friday when the biggest single-day drop since August cleared channel support, a 50-day moving average and the ‘neckline’ of the head-and-shoulders pattern formed this past six weeks.
| Change in | Longs | Shorts | OI |
| Daily | -4% | -1% | -3% |
| Weekly | 12% | -4% | 2% |
Chart of the Dow Jones Industrial Average with 50-Day Moving Average (Daily)
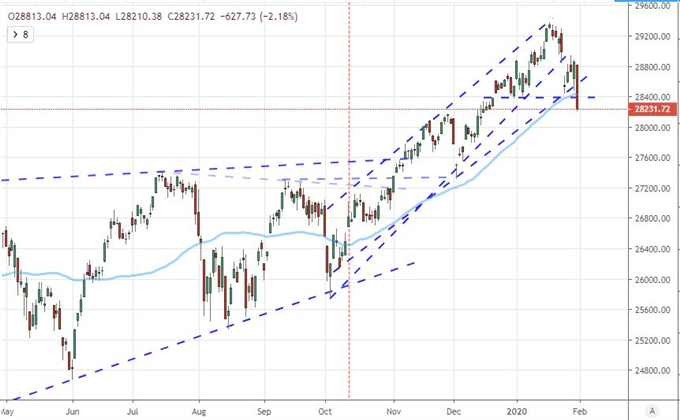
Chart Created with TradingView
Looking ahead to the new trading week, it is important to be mindful of the progress that may build behind a shifting bias. Sentiment can be remarkably powerful, easily casting aside or even running roughshod over important fundamental developments. What starts the ball rolling can vary depending more on the timing than the actual event itself. Given the backdrop of traditional fundamental lethargy these past months and the incredible speculative reach over the same period, the environment is such that a swing in market appetites will find a situation ripe for fear should it find its way in. That turning point has been difficult to assess for months with numerous false starts despite a fundamentally loaded backdrop. That is where technicals can add another layer of qualification. In particular, I’m on the lookout for another significant Monday gap in the week ahead. The Dow suffered its largest weekly bearish gap in over a decade this past week. Another sudden loss altitude anywhere near that magnitude so soon will be difficult for even diehard optimists to overlook.
Chart of the Dow Jones Industrial Average with Weekly Gaps (Weekly)
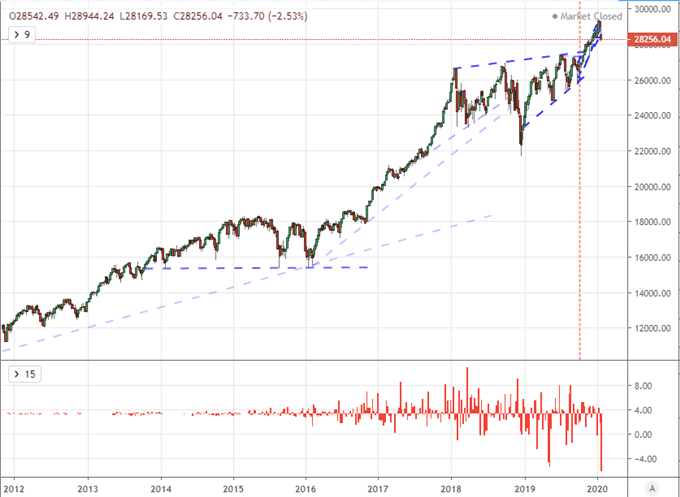
Chart Created with TradingView
Coronavirus Fears Transition to Abstract Threat to FOMO to Tangible Economic Throttle
As we track the rolling over of investor confidence, it is hard to miss the justification they are flocking to for their concern. The coronavirus originating from the Wuhan state in China reportedly spread to nearly 11,800 cases and a death toll of 259 as of Friday evening according to Reuters. That is troubling in itself, but more remarkable is the political response to the spread. The reports from China reflect on a country taking drastic measures to restrict the virulent spread. The rest of the world is not improving those serious concerns with the WHO calling a health concern and the United States announcing a public health emergency with potential bans on immigration. It is worth noting that the SARS outbreak back in 2003 saw the Chinese economy slow from an 11.1 percent pace to 9.1 percent, but that was when China accounted for 4 percent of global output. Nowadays, it represents will over 15 percent.
Chart of USDCNH with 100 and 200-Day Moving Averages (Daily)
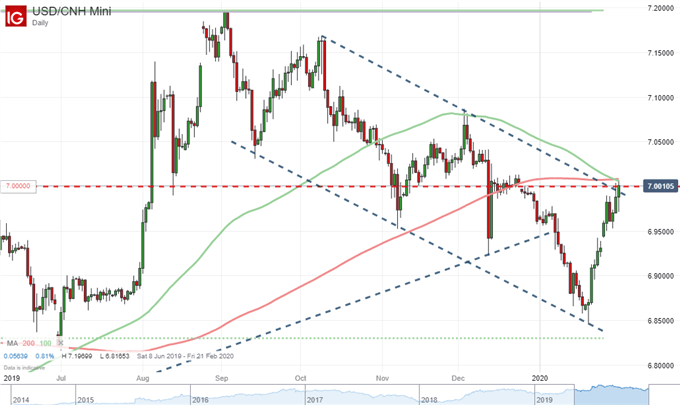
Chart Created with IG Trading Platform
When it comes to the barometers of global health crisis, the US indices and related systemic risk assets are the further ring of the spheres of influence. Much closer to the core, I will be watching the emerging markets benchmarks – EEM ETF and EM currencies which export an important percentage of their raw materials to this superpower. A step closer, the Australian Dollar is finding itself in the direct line of fire. The currency and country managed to avoid a recession during the 2008 Great Financial Crisis largely owing to its tether to China. That same connection works both ways however. AUDUSD closed at its lowest level since 2009 on Friday. And then there are direct Chinese benchmarks. Chinese capital markets (the Shanghai Composite) will reopen after the extended holiday Monday, but FXI offers little optimism. Further USDCNH is pressing the same 7.0000 level that was weaponized during the height of the US-China trade war.
| Change in | Longs | Shorts | OI |
| Daily | 1% | 3% | 1% |
| Weekly | 21% | -17% | 11% |
Chart of AUDUSD with 200-Day Moving Average (Daily)
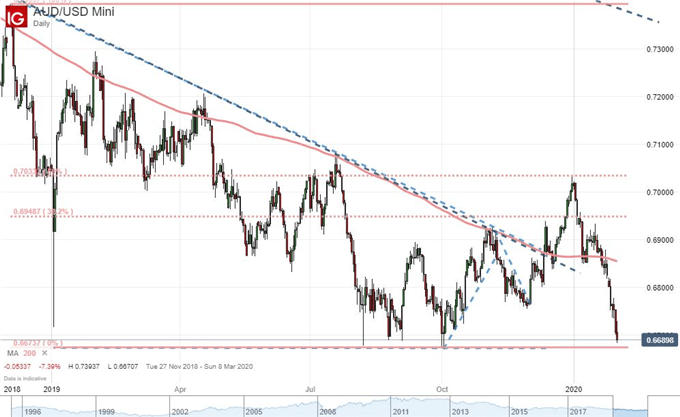
Chart Created with IG Trading Platform
A Bearish Bias and Virus Headlines Can Trigger the Traditional Fundamental Themes
As with most phases of economic and financial disruption in the past, there is great emphasis afforded to the initial catalyst. It is that most present and headline dominant theme that tends to take the credit for the market fallout that follows. Yet, most of the time, it is the conditions that have developed – and been ignored – for the days, weeks and months prior to the high-profile spark that are the true culprit of the painful complications that follow. The market seemed to already start registering the economic implications of the virus in the week that passed. A soft US 4Q GDP reading this past week was glossed over, but the re-evaluation of circumstances after the fact are picking back up on the situation. If fear holds through Monday, another round of economic data is scheduled for release – including the Chinese January manufacturing report, US service sector activity update, auto sales figures and continued 4Q earnings releases. Keep tabs on crude oil, copper and Treasury yield curves (particularly 10-year to 3-month) to assess the growth sensitive of the risk metrics.
Chart of US Crude Oil CFD (Daily)
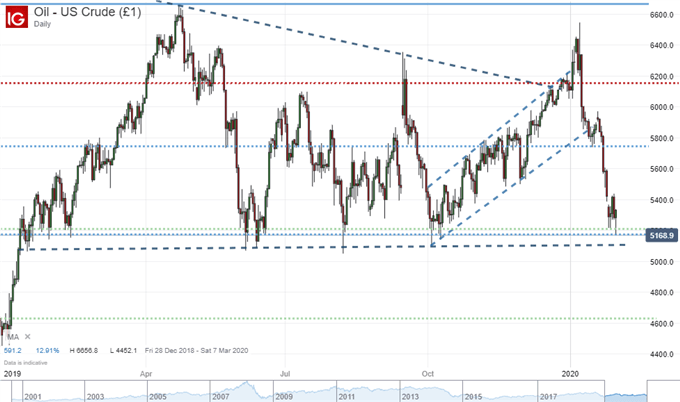
Chart Created with IG Trading Platform
While the connections to economic output may remain the most tangible traditional fundamental risk for which markets bridge, the other high tides will feel the impact should the waves persist. Trade seems to be on a favor upswing with 137 countries agreeing this past week to continue negotiations on taxing global tech companies and the US-China Phase 1 trade deal signed off. That said, with the progress populism has forged these past few years, the risk of pursuing policy that supports local growth at the expense of global health intensifies as stability falters. The 7.0000 level on USDCNH or 1.0900 for EURUSD should be monitored closely given this backdrop. As for monetary policy, as conditions deteriorate; desperation rises and the expectation for the usual firefighters coming to the rescue builds. That said, with rates already at global extreme lows and the global stimulus at such blistering levels, concern over the effectiveness of subsequent waves of support would be well-deserved.
Chart of S&P 500 with the Aggregate Balance Sheet of Major Central Banks (Monthly)
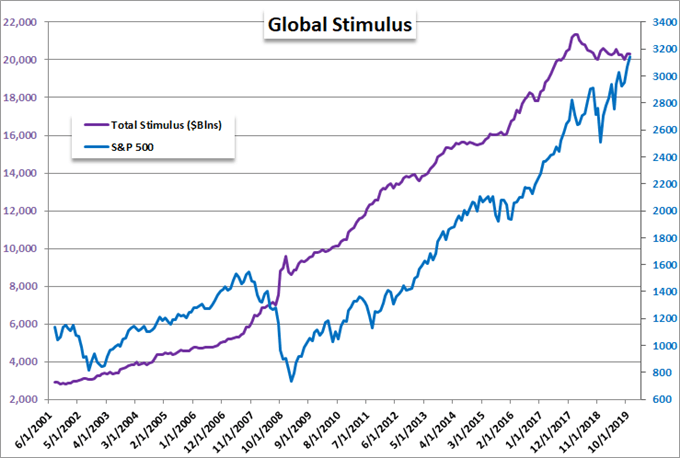
Chart Created by John Kicklighter with Data from Bloomberg Platform
If you want to download my Manic-Crisis calendar, you can find the updated file here.
.


