


US-Iran Talking Points:
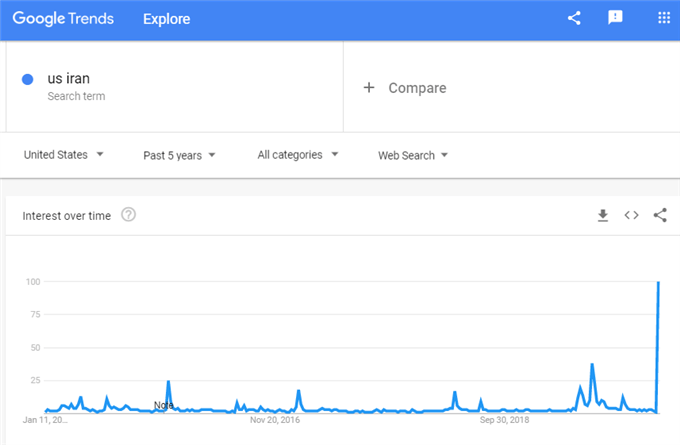
- The weekend only added to the uncertainty around the US-Iran tension following the former's killing a top Iranian general last week
- Despite severe implications of an open military engagement and its troubling probability, risk trends found stability and even a bid Monday
- Perhaps a shortfall in an unrelated, more traditional vein can justify risk aversion overlooked through geopolitical terms

Geopolitical Risks Remain but Capital Markets Will Not Be Denied Their Climb
We ended this past week with an unmistakable sense of concern for the financial markets. It wasn't the carry over weight of a near-two year trade war or concern that monetary policy was losing its effectiveness while still standing as a crucial pillar of growth and stability. Rather, the novelty of geopolitical tensions seemed to pick up the baton of concern. Yet, as has been the case with these other systemic matters, the stretch of influence was a mere sprint. Conditions have not improved measurably since the United States struck a convoy near Baghdad that killed a top Iranian general. Both sides have issued warnings of reprisal with Iran suggesting US military targets may be attacked and US President Donald Trump stating a list of additional targets was already in place should Iran seek retribution. Adding to the trouble, there have been reports that the US is preparing to withdrawal from Iraq, though those have been disputed.
The lack of 'de-risking' around this threat is not likely reflecting a belief that the impact of a worsening in relations simply won't exact a serious economic and financial toll. Ratings agency Moody's issued just such a warning this past session. Nor should the market's nonchalance be considered a view of probability to a worsening of relations and the toll that would take. The terms are severe between these two economies and leadership is for both is particularly obstinate. Rather, I believe what we are seeing is more a matter of time. Speculators have shown a remarkable complacency with very tangible fundamental risks, willing to build up exposure so long as the reckoning is not considered immediately at hand. As with the compounding risks of trade conditions, growth tempering and monetary policy cracks; the compounding effects of the situation are likely to create serious problems. But for now, it is being treated as an opportunity for a quick pullback to the continuous grind.
Even if the markets maintain a remarkable tolerance for aloofness, eventually, the risks for rebalancing will be so large that probabilities will be tipped. It is difficult not to consider the S&P 500 and US indices as the most richly priced an broadly indulgent financial system. The benchmark US measure opened the new week with a gap lower, but the losses quickly dried up for a full recovery through the end of the trading day. All the activity in the session notably held above the past few week's range low - notably sizing up a head-and-shoulders pattern. Yet, the SPX wasn't the only measure showing aloofness. The rest-of-world equity ETF VEU and all-world ACWI offered very similar pictures. Emerging markets, high-yield bonds, carry trade and more followed a similar template. The degree of intensity differed, but the general performance was all the same: a quick reversion to risk appetite.
Chart of S&P 500 and Daily Gaps (Daily)
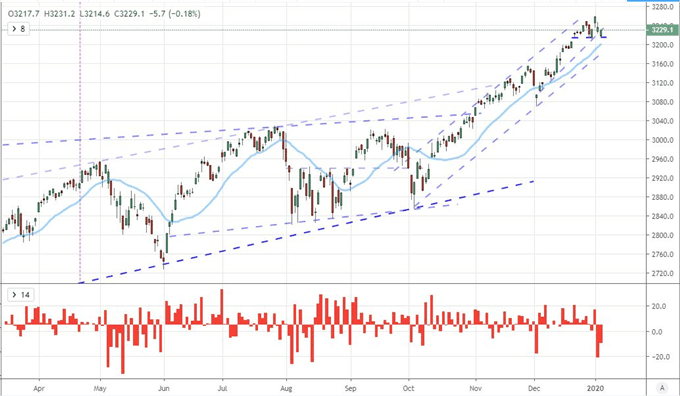
Chart Created with TradingView Platform
A Key US Indicator May Catalyze a Market Committed to Complacency
Geopolitical tensions may be the latest systemic risk that misses the mark when it comes to upending speculative appetite, but the pressure nevertheless counts. The pressure will accumulate between this new matter and the more familiar matters, but the spark can come from any point on this complicated fundamental map. A sudden devolving in global stability prompted by a war could readily trigger risk aversion. However, in the absence of a tangible crack in this particular facade of stability, we will need to look elsewhere, As usual, I tend to make fewer plans around even high-level themes if there are no reliable milestones to plot against. One particular matter with an imminent spark is economic activity - aka the potential of recession fear. The world's largest economy is due a progress report from the sector responsible for the vast majority of output and employment: services.
Chart of S&P 500 with ISM Manufacturing and Services Activity (Monthly)
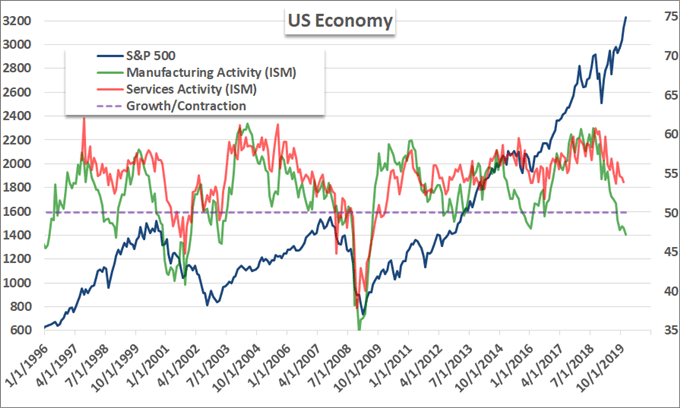
Chart Created by John with Data from Markit
The ISM's service sector report carries a particularly skewed potential. This figure has a longer history of generating market friction (volatility) for an economic update relative to the Markit's own monthly figure. The manufacturing report last week surprised to the downside with a slide deeper into contractionary territory - the lowest reading since the Great Recession. For the United States, this is not the kiss of death. The country - along with most developed economies - is heavily dependent on it service sector for total GDP. That has staved off recession fears thus far. That said, should this increasingly important sector fade into malaise, the signal will be difficult to ignore. This makes for a very important economic update with a particular skew in potential outcomes. A strong ISM services report is likely to reinforce the status quo. Alternatively, a disappointment could very well tip the balance on complacency.
The Unusual Case of Gold, Dollar and USDCNH
If you were looking at the range of risk-based assets as we debate the strain between an aggregated economic struggle and speculative complacency, the picture is remarkably similar whether we talk about the high-risk/high-return side of the spectrum or the safe haven end. Perhaps one of the most atypical cases however is made by gold. The precious metal has played the role of safe haven but has notably refused to back down as speculative appetites have won out this past year. Why? Gold is playing the role not just of a safe haven but also an alternative to traditional currencies (and their critical assets like government bonds) which have wilted in response to central banks' attempt to thwart pain. In this past session, the metal did drop back alongside the risk appetite boost; but gold would gap higher on the open, hit a near 7-year high and extend a 9-day rally. Will the tail it produce signal a reversal or prove another ill-served lesson.
Chart of Gold with Tails (Daily)
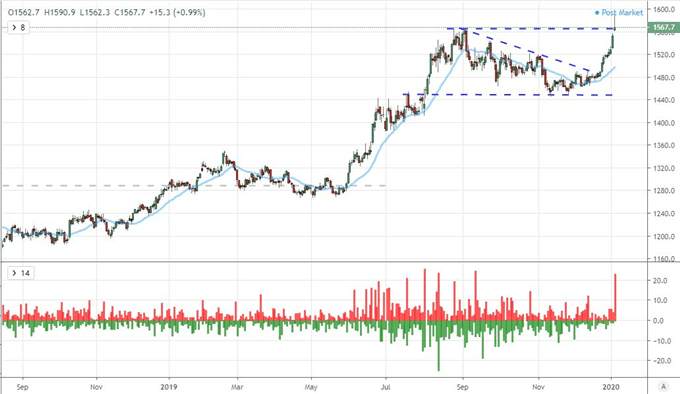
Chart Created with TradingView Platform
Another asset that has shown remarkable disparity to the standard mix is the US Dollar. As with the trade wars and monetary policy mix, the geopolitical tensions seem to have tighter connection to the United States than most other countries. Nevertheless, the Greenback doesn't seem to be suffering for its roll. The benchmark managed to hold back from a more telltale reversal averted this past week. Complacency only lasts so long though. Eventually, safe haven or yield advantage will win out for this principal currency.
Chart of Dollar Basket (Daily)
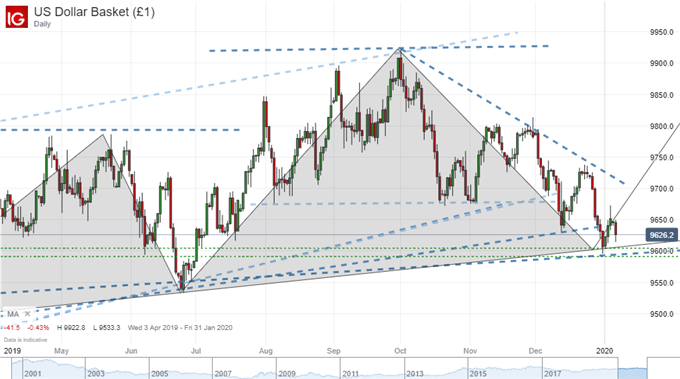
Chart Created with IG Trading Platform
On a different, specific fundamental line, it is remarkable that the USDCNH is not marking a more committed tempo. Whether full buy-in or skepticism, it would seem that the world has plenty of evidence to make a commitment of headlines in US-China trade relations after years of steadfast escalation. There were reports that China was sending a delegation to sign the planned January 15th Phase 1 agreement, but State-sanctioned Global Times suggested the terms should not be rushed - an unusual effort to throttle enthusiasm from the typical cheerleaders. On the other hand, USDHKD continues its tumble back to the peg (tumbling from the upper bound of the tolerance band). Is this a reflection of the HKMA or a statement on the more temperate USDCNH?
Chart of USDHKD with Weekly Consecutive Candles (Weekly)
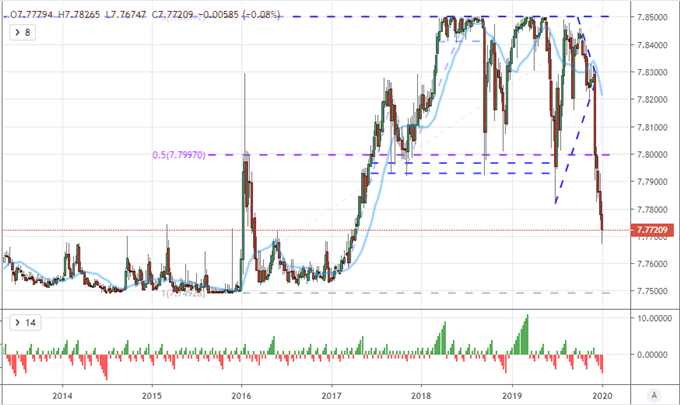
Chart Created with TradingView Platform
If you want to download my Manic-Crisis calendar, you can find the updated file here.
.


