
Volatility Talking Points:
- Though there is still liquidity for the week, the S&P 500 seems to be succumbing to a full holiday drain with slowest trade in 2 years
- If there is any potential for systemic upheaval, it is likely to come through trade wars; otherwise mark the range candidates
- Event risk saw NZ GDP draw little movement, Aussie jobs data is ahead and the Bank of Mexico is the most potent of three rate decisions
What do the DailyFX Analysts expect from the Dollar, Euro, Equities, Oil and more through the 4Q 2019? Download forecasts for these assets and more with technical and fundamental insight from the DailyFX Trading Guides page.
Liquidity is Draining Early, Freezing S&P 500 at Record Highs
We have passed the mid-point for the last full trading week of the year, and the speculative rank looks intent to drift further out into the warm sea of complacency. Looking back to the final weeks of 2018, some may hold out that perhaps there is a chance of sudden volatility. It is true that December 2018 was exceptionally volatility despite the seasonal conditions, however the environment last year was significantly different to what we have experiencing these past few months. Volatility has been held in check these past few months with a steady climb in risk assets throughout the period. Turning back the clock a year, the fourth quarter saw benchmarks like US indices diving. Momentum was already running at a heady pace by the time the holiday hit and fear is an overriding emotion compared to passive optimism.
Chart of S&P 500 Around 2018 Holiday Period with Dec 18, 2018 Highlighted (Daily)
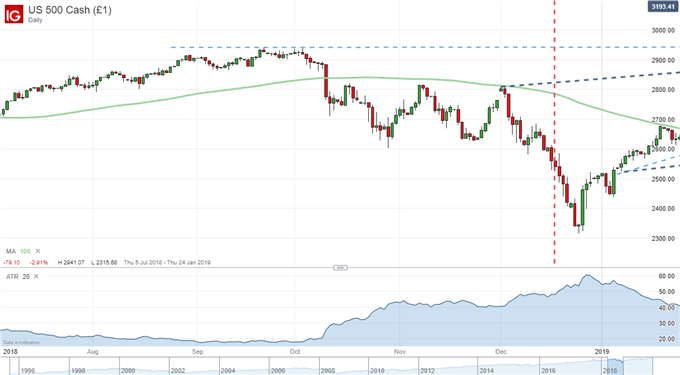
Chart Created with IG Charts
Given these disparate conditions, unless there is a systemic surge in fear for the markets, it would be very difficult to break the complacency. I always hold open the possibility for something to go terribly wrong in the financial system, but I don't make it a point to presume it will occur. If there were a reasonable chance of a thematic surprise, I would put a lower probability on a sudden collapse in growth forecasts or confidence in monetary policy. Those are measures more dependent on scheduled data or meetings. Trade wars on the other hand seem to be more frequently directed by headlines. If the US-China friendship sprint were to sudden breakdown or the US make clear that it intended to pursue a direct trade war with Europe, the fallout for USDCNH or EURUSD would be immediate while the risk implications could follow on. In the meantime, the average of the S&P 500's past two-day range is the most restricted seen in two years.
Chart of the S&P 500 with 2-Day Average True Range (Daily)
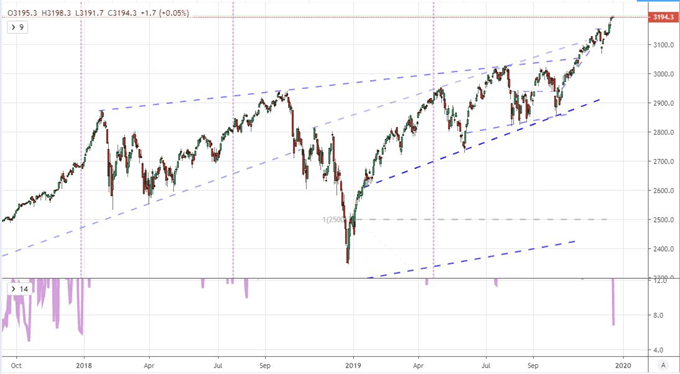
Chart Created with TradingView Platform
Potential in Technical Patterns
If we are already caught in the undertow of holiday liquidity conditions, I will look to align my perspective to the prevailing activity levels. Anticipation for capped liquidity caps the potential for momentum - whether that be an extension of a pre-existing trend or a productive reversal of one. There is something to be said about assets that have been pushed to extremes through either leverage or one-sided positioning - such as the S&P 500 pushing to record highs. If there is a natural unwind to occur for profit taking purposes or simply a desire to reduce leverage, either development would see the US equity index retreat. Such a move - so long as it isn't motivated by an overt fundamental shock - shouldn't be presumed to be a systemic reversal but rather a measured retreat until liquidity hits the dregs.
Alternatively, established ranges with reasonable spans can be traversed with only modest sparks of motivation. EURUSD worked its way into a tight ascending wedge this past session with a short-term break lower - back into the well-formed larger channel. That is the sort of break for which reasonable anticipation can be followed. USDCAD is another example of a reasonable target as its range may be significantly wider, the tempo has afforded possibility - particularly when an indicator of note like the Canadian CPI helps the pair along. Perhaps the most appealing range in my book is USDJPY. There is not much in the way of fundamental Dollar landmines ahead and risk appetite will be difficult to drive any further. That makes the well-worn 109.75 to 108.50 range more practical.
| Change in | Longs | Shorts | OI |
| Daily | 4% | 2% | 2% |
| Weekly | -8% | 4% | 2% |
Chart of USDJPY with 100-Day Moving Average (Daily)
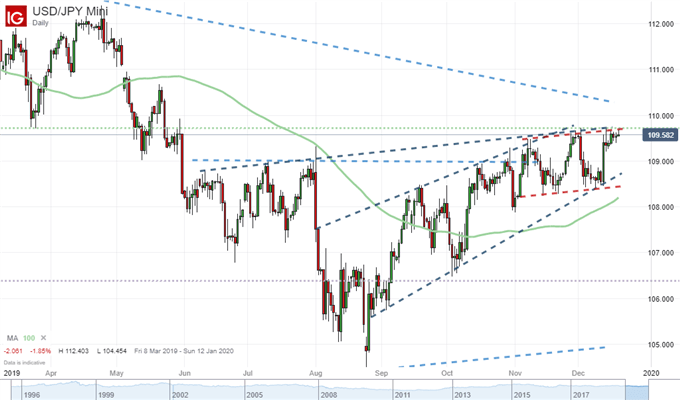
Chart Created with IG Charts
Targeted Volatility for the Pound, Aussie, Kiwi and Peso
With he focus on more measured moves and technical standings that support the limited engagement, we can then start filtering currencies with specific event risk that offer enough pressure to urge the technical pattern to play out. The Sterling has taken a dramatic turn in course this past week as Prime Minister Boris Johnson's warning that a 'no deal' Brexit is still a clear option has dampened enthusiasm that a common position from the UK in the negotiations with the EU does not translate into a more gentle outcome. GBPUSD among other Sterling crosses have a lot of room to reverse, but this is not exactly an urgent pressure to deflate undeserved premium here and now.
Chart of GBPUSD with 50-Day Moving Average and 5-Day Momentum (Daily)
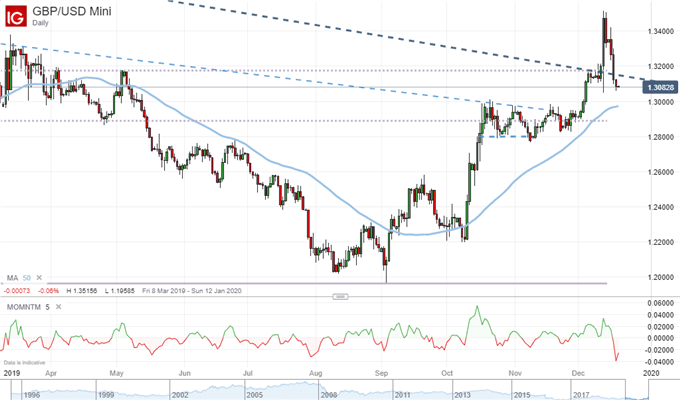
Chart Created with IG Charts
In contrast to headlines, scheduled event risk offers a more focused and reliable impact for short-term volatility. The New Zealand 3Q GDP data this past session was modestly better than expected, but that wouldn't earn much in the way of lift for the Kiwi Dollar. This morning's Australian employment statistics were a little more resounding in the surprise quotient, but here too, I would play down a pair like AUDNZD attempting a multi-month trend reversal and instead consider AUDCAD or EURAUD which conform to much more reasonable ranges. In the next 24 hours, a clear theme will arise out of a run-in central bank rate decisions. The Bank of Japan (BOJ) is not going to change in its already-extreme easing course as it has no inflation or growth mandate - and the markets have yet to punish their loss of influence. The Bank of England (BOE) is still unrelentingly bound to Brexit uncertainties which makes changes in policy moves to response to financial or economic instability rather than simple inflation. The central bank decision I will look to offer some sort of insight is the Central Bank of Mexico. Though they are already expected to cut their benchmark by 25bps, USDMXN is plumbing broad range lows. Keep tabs.
Chart of USDMXN with 200-Day Moving Average (Daily)
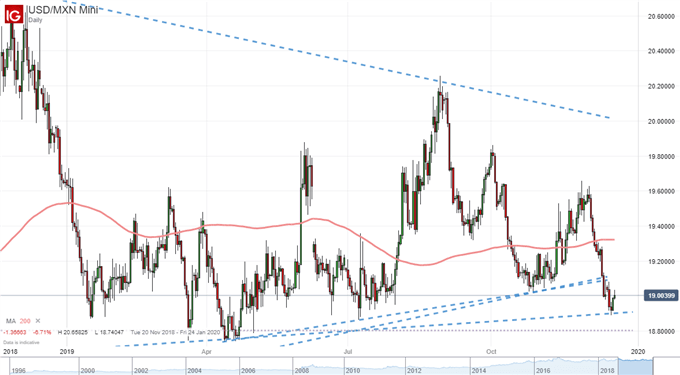
Chart Created with IG Charts
If you want to download my Manic-Crisis calendar, you can find the updated file here.
.