


Dollar Talking Points:
- Risk trends have moderated with the rebound from the week's opening 48-hour tumble leveling out, and liquidity will direct our course now
- The Dollar is facing a confluence of key technical support and high-potential event risk in NFPs and the UofM sentiment survey ahead
- Keep tabs on the Canadian Dollar and Pound as local employment statistics and election polls respectively bolster activity
Liquidity Is Draining, Leaving Range and Breakouts More Practical Than Trend
Though there remains an elevated measure of uncertainty and risk volatility through measures like the VIX, the barrier to reviving a systemic 'risk' move is rising. There remains the higher-level restriction founded on years of compounding complacency converging with the seasonal drain typical to the final month of the year. I have little doubt that this extreme of inactivity will inevitably normalize first through an initial period of exceptional volatility. Yet, the spark necessary for catching this market alight must be increasingly more substantive as market depth thins. Through the immediate future, the throttling mechanism is a practical one: we are entering the final hours of trade for the week before the weekend drains the market completely. It is not impossible to leverage a sharp move from key markets, but it would certainly be very difficult to establish a committed trend at this momentum.
Chart of S&P 500 and VIX (Daily)
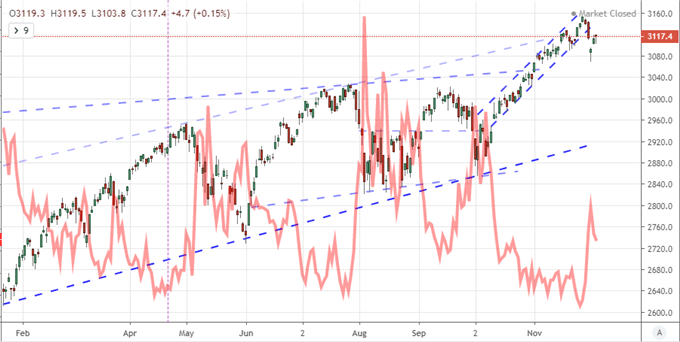
Chart Created with TradingView Platform
I like to consider these market conditions - namely participation in liquidity and volume - as filters for the type of environment that we are dealing with: range, breakout or trend. Given the restriction on trend owing to the weekend drain, December drain and years of restraint; it seems pursuing trends is the least fruitful approach. In contrast, range and breakout are two sides to the same coin. The expectation for both is limited duration. With a range, the movement holds neatly to technical boundaries and a 'path of least resistance' coasting is more feasible. Breakouts can develop depending on the source and signal of fundamental or speculative charge, but set reasonable expectations for follow through. If you were to use a benchmark like the S&P 500 as your gauge for sentiment and market type, it would be tempting to suggest trends are the norm. However rest of world indices (VEU), emerging markets (EEM), carry trade (USDJPY) and other risk trades paint a very different portrait.
Friday's Top Event Risk - NFPs and US Sentiment - Is More a Dollar Than Capital Market Cue
Compared to the first half of this week, there has been a notable slackening in the market's responsiveness to thematic headlines recently. Trade wars once again proved the top market mover this week as headlines around rhetoric reflecting perspective of progress in trade negotiations. President Trump's off-handed remark that it may be better for the US to hold off on a deal with China until after the election triggered the pressure-relieving break. Remarks by US Treasury Secretary Mnuchin that seemed to raise questions of the December 15th escalation date, comments by a Chinese Ministry of Commerce spokesperson could be interpreted and the US trade deficit dropping to a 16-month low (on a drop in exports and imports). USDCNH was little moved by the mix, and that pair is far more responsive than general risk assets to this theme.
Chart of USDCNH with 100-Day and 200-Day Moving Averages (Daily)
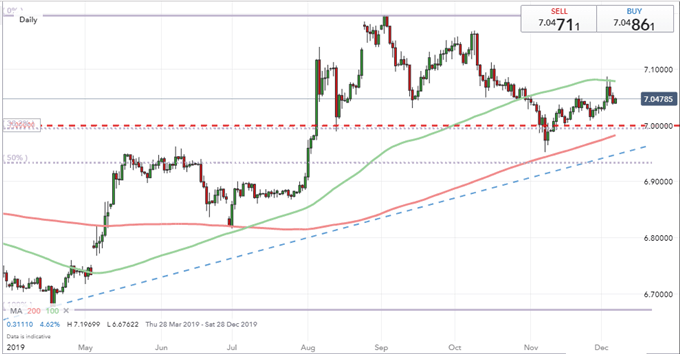
Chart Created with IG Charts
In the three all-encompassing themes I've kept track of these past months (trade wars, recession fears and monetary policy), there is notable lost traction. Yet, potential doesn't have to raise to the level of systemic market movement. With top event risk ahead, there is clear opportunity for the US Dollar in particular. That is as much a function of the Greenback's own technical position as it is the potency of the high-level data. The DXY Dollar Index has slid for five consecutive trading sessions through Thursday. That matches two similarly long swoons these past few months, but we haven't had a six-day drop since May 2016. Pair that with the proximity the currency holds to the floor of its 19-month rising trend channel, and there is an innate opportunity for volatility around a key technical pattern - for range reversal or bearish breakout depending on the level and direction of any surprise.
Chart of DXY Dollar Index with Consecutive Candles (Daily)
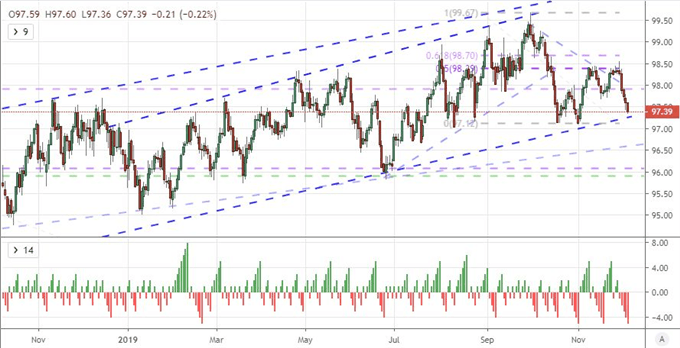
Chart Created with TradingView Platform
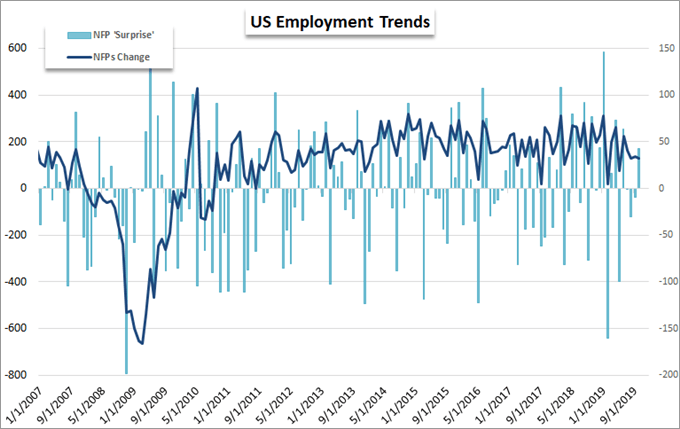
The two events of considerable prominence Friday are the November nonfarm payrolls (NFPs) and University of Michigan consumer confidence survey. The lesser of these two releases is the later-released sentiment report. It can still spur concern or enthusiasm over the largest aggregate consumer in the entire world, but anything short of an extreme update will likely fall on deaf ears. I will not write off its risk-trend and recession inference potential however. The more laden event will be the employment survey. The payroll figure carries the most targeted volatility opportunity. A significant beat or miss could readily spur a risk-based (S&P 500 or Dow) response. For the Greenback, I will be watching the wage growth figures as that is the contention of true labor trends and the foundation of inflation expectations.
Keep Tabs on the Canadian Dollar and British Pound
Aside from the anticipation around the Dollar and the state of readiness in risk assets, there are a few other direct assets to watch. The Canadian Dollar stands to receive the other major event risk for Friday's session. The local employment report has a history of generating significant volatility for the Loonie when there is a tangible surprise relative to forecasts. In the wake of the currency's rally following the BOC neutral stance earlier this week, we find a short-term bullish stretch. We could fuel momentum with a favorable reading or spark a reversal depending on the update, but the choice of pair is just as important as the data valuation. USDCAD is one of the most appealing technical pictures holding near the middle of its multi-month range, but AUDCAD can perhaps leverage volatility currently at its own congestion floor.
Chart of AUDCAD (Daily)
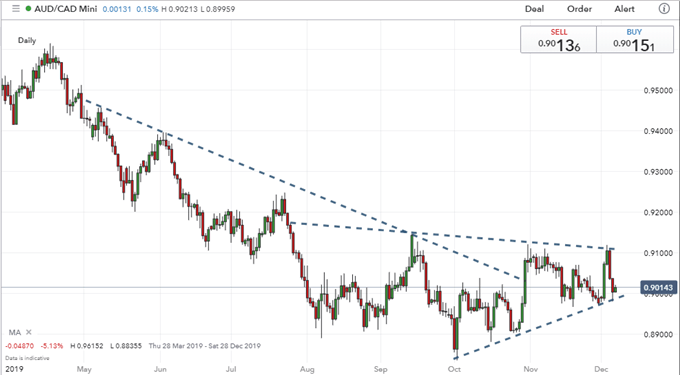
Chart Created with IG Charts
| Change in | Longs | Shorts | OI |
| Daily | -2% | -11% | -5% |
| Weekly | 0% | 1% | 1% |
The other currency that warrants close observation, doesn't have a targeted event risk ahead. Instead, the British Pound is showing remarkable technical progress following weeks of uncertainty on a theme (Brexit) that now seems colored by opinion polls. The markets were remarkably listless as the future of the UK-EU divorce seemed to be floating in the wind, but a more binary outcome for the UK general election on December 12th seems to have better captured FX traders' attention. The polls have shown a growing support for a Tory win. The break higher for GBPUSD and drive lower for EURGBP is not a sign of preference from the markets but rather appetite for a clear outcome after years of uncertainty. Keep tabs on this headline-driven theme as well as the critical technical levels on key pairs.
Chart of GBPUSD with 200-Week Moving Average (Daily)
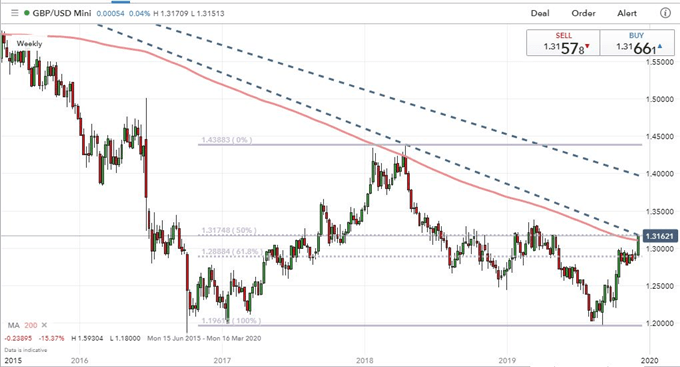
Chart Created with IG Charts
If you want to download my Manic-Crisis calendar, you can find the updated file here.
What fundamental themes should you follow next week? How will they impact the markets at large? Sign up for our webinars to better evaluate how market developments are shaping markets. Sign up on the Webinar Calendar.
.


