


Trade War Talking Points:
- A bounce for S&P 500 buffered familiar speculative desperation but seasonal conditions may not hold off increased frequency of volatility
- The most frequently referenced source of renewed optimism Monday was a particularly dubious highlight in US-Chinese language
- Jackson Hole failed to offer the monetary policy assurances many were hoping for and the yield curve is gaining as a recession reading
What do the DailyFX Analysts expect from the Dollar, Euro, Equities, Oil and more through the 3Q 2019? Download forecasts for these assets and more with technical and fundamental insight from the DailyFX Trading Guides page.
Trade Wars Words Versus Trade War Actions
It seems I take days off from the markets at the most inconvenient times. Through the end of last week, the US-China trade war escalated sharply; and capital markets responded in kind. China finally came forward with its intended policy response to the announced expansion of the US tariff list on Chinese goods to encompass the remainder (approximately $300 billion in goods) at a 10 percent tax rate. Somewhat surprising was their pursuit of the conventional policy tool of a $75 billion in products it intended to hit with fresh tariff and the restoration of a US auto import tax suspended in April. The USDCNH showed responded with a further climb, but that advance - and the slide in risk assets like the S&P 500 - accelerated when just hours later, President Trump answered with an extreme counterpunch. The White House with boost the tariff rate on existing and planned levies - 25 to 30 percent on $250 billion and 10 to 15 percent on $300 billion goods respectively. The truly troubling aspect of this latest escalation though was the President's threat to active a supposed executive power to force US companies to leave China. That measure would prove a far more severe shock to US business health - much less global trade.
Chart of USDCNH and 3-Day Rate of Change (Daily)
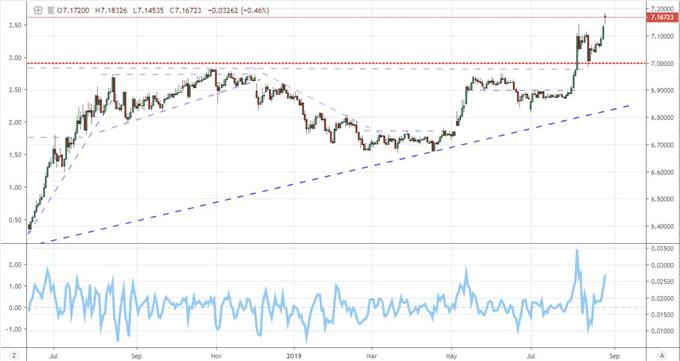
Chart Created Using TradingView Platform
There is little mistaking how extreme the tension is between these two superpowers and their propensity to continuously escalate their economic war. As such, the relief that seemed to come through in Monday's open is seriously suspect. As far as headlines would assess, the bounce from Friday's plunge was founded on President Trump's remarks that US negotiators were talking with their Chinese counterparts to reopen negotiations and Beijing's call for a "calm" end to the trade wars. Offering up a positive spin through commentary on an otherwise taxing situation for the economic and financial outlook is the bare minimum we would expect in normal circumstances. Yet our environment is far from 'normal'. The consistency with which these peers-turned-competitors have reverted to aggression these past months should keep all market participants on guard. No material plan has been given to de-escalate the trade war and recent moves were not disavowed. That state of affairs is not lost on the market; and as such, any effort to charge risk trends should be viewed with serious skepticism for subsequent follow through.
Liquidity Still a Critical Factor
As we evaluate the market's willingness to 'coast' on questionable risk trend reinforcement, it is also important to weigh the general market conditions with which we are operating. While we are still dealing with unresolved thematic risks, there are no singular high-level events with which we can project our hopes and expectations for resolution - for better or worse. There are no Jackson Hole Symposiums or G7 summits on which we can anchor our expectations through the near future. That will lead us to revert to more seasonal conditions. While we have seen a remarkably active August with the three biggest single-day losses this year all tallied within the month, we have not been able to generate a reliable trend to counter the typical August conditions. Historically, the holiday period around the US Labor Day is plagued by much the same wheel-spinning that we have been talking about all month.
Seasonal S&P 500 Performance and Volume by Month
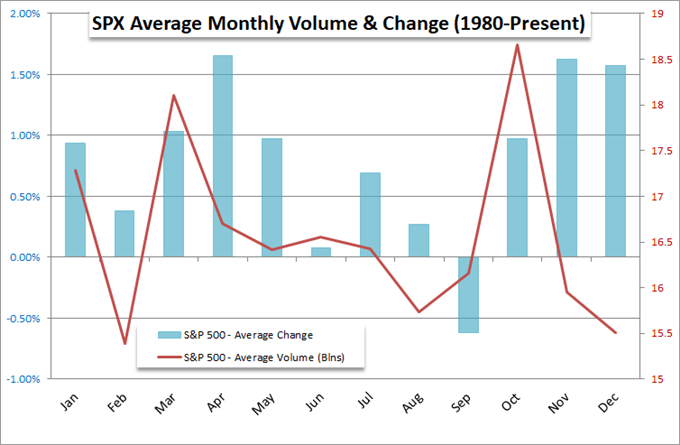
To leverage a break - bullish or bearish - from a benchmark risk measure like the S&P 500 which is stretched for value but deeply rooted in the benefits of complacency, we need both a catalyst and a speculative market willing to commit to a wholesale rebalance of speculative exposure. It's not impossible, but it would be exceptionally difficult to inspire. That said, the transition we are expecting with the convergence of general conditions picking up in September (the worst month for the same benchmark on average) and persistent waves of high-level fundamental risk continuously testing the collective resolve should keep everyone on guard of the risks that they are taking. One particularly critical sign on my radar is the frequency of volatility lately. We have seen swells in measures like the VIX diminish with each subsequent shock since the initial February 2018 jolt, but the real threat to stability is the frequency with which these jolts occur. The more frequently the tides change, the less stable markets will seem.
Chart of VIX Volatility Index (Daily)
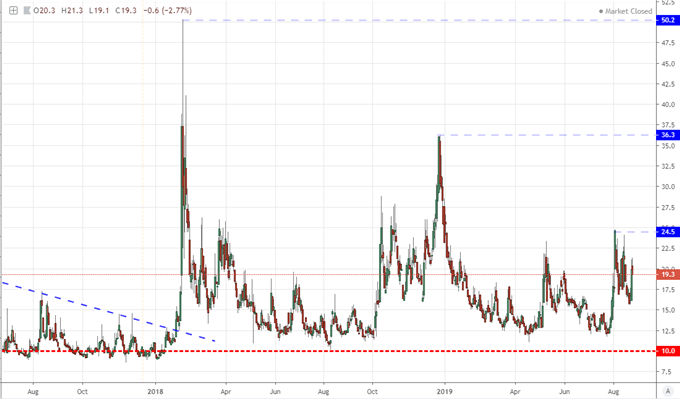
Chart Created Using TradingView Platform
Jackson Hole Proved a Disappointment for Those Looking for Reassurance
As trade wars continue to impart their unique brand of fear, the dependency on external measures of support grows. Perhaps the most familiar measure of counterbalance is the influence of monetary policy. Yet, this pillar of strength over the past decade is buying less and less buoyancy through growth and capital market performance. With the markets concerned over the state of the economy and the compounding external risks, greater weight is put upon the effectiveness of the Fed and other major central banks. Therefore it was likely that a lot of the market's confidence was riding on officials attending this past week's Jackson Hole Symposium to make a more convincing case that they would be able to put out impending fires that seem inevitable. Unfortunately for those holding out hope, there was very little build up added to the safety net.
Chart of S&P 500 and Total Stimulus of Major Central Banks (Monthly)
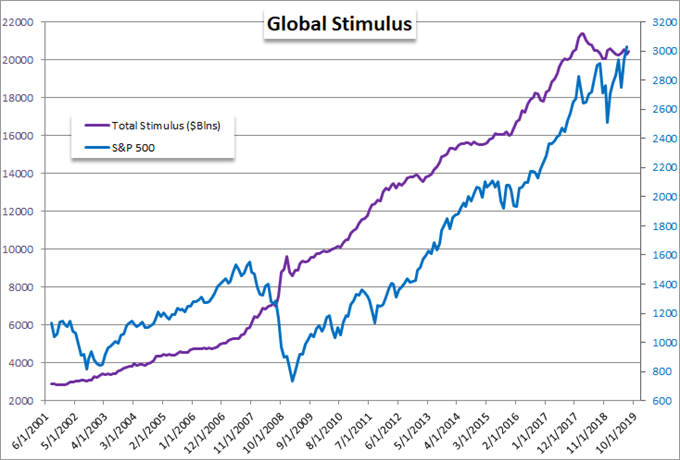
In particular, Fed Chairman Jerome Powell's speech at the event in Wyoming offered little of the sought after capitulation hoped for from the world's largest - and most hawkish - central bank. There is still an enormous gap between what the market expects in terms of easing and what the policy authority itself is willing to project. Overnight rates are still pricing in approximately two more, quarter-percent cuts before year end and further heady easing through 2020, but the Fed is sticking to its 'mid-cycle adjustment' language.
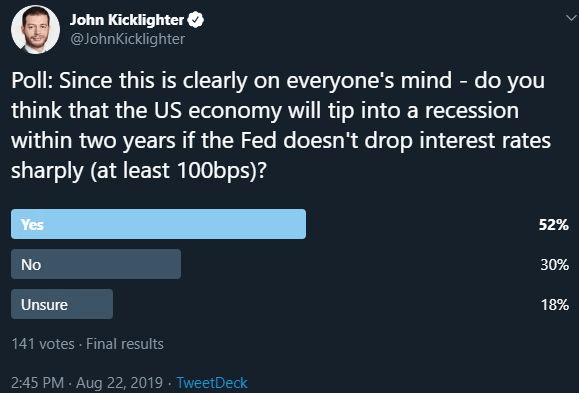
Twitter Poll on Fed Influene on Economy
Recession Watch Increasingly Moving to Market Measures Rather Than Data
Meanwhile, where external risks like trade wars persist and supplementary support is increasingly unreliable, the threat of an economic stall gains in probability. Yet, the market is still showing remarkably limited response to the typical culprits for fear over the march towards recession. Traditional economic data is meeting less and less response from the consumer, business leaders and investors alike, as if the inevitable is already accounted for and ultimately unimportant. In reality, the market is seeking guidance less and less from delayed recordings of performance and increasingly dependent on the speculative signaling of measures like the Treasury yield curve. Once again Monday, we found the 'traders' favorite' 2-10 year curve invert - though it didn't draw the extreme response it earned on August 14th when it slipped below zero for the first time in years. Watch the market's take moving forward.
Chart of Treasury 10yr2yr and 10yr3mth Spreads (Daily)
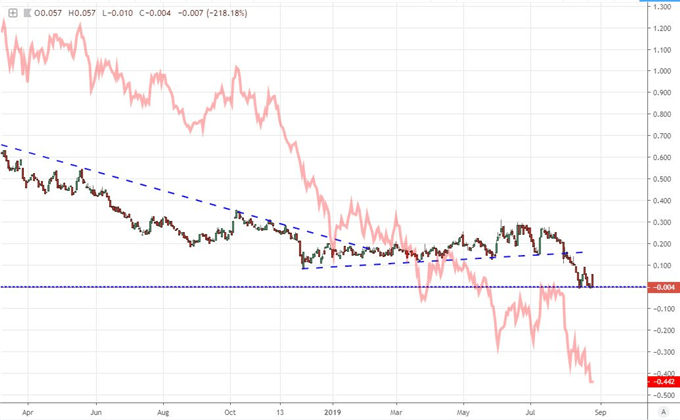
Chart Created Using TradingView Platform
If you want to download my Manic-Crisis calendar, you can find the updated file here.
What fundamental themes should you follow next week? How will they impact the markets at large? Sign up for our webinars to better evaluate how market developments are shaping markets. Sign up on the Webinar Calendar.


