


Risk Trend Talking Points:
- The Dow, S&P 500 and other US indices led a risk-oriented correction this past session
- At the same time that traditional risk assets turned, the Dollar bounced and Gold put in for a large tail
- Geopolitical tensions dominated the headlines, but trade wars and monetary policy remain more effective market movers...when moving
See how retail traders are positioning in S&P 500, Gold and Dollar-based majors along with the other key FX pairs, indices and oil intraday using the DailyFX speculative positioning data on the sentiment page.
A Committed Reversal or Simple Loss of Momentum?
It seems the markets are in the 'fundamental irons' - borrowing a nautical term referring to situation when the bow of the boat is heading into the wind and unable to maneuver. The motivation from the Fed's shift to support dovish market speculation this past week seems to be loosening its hold and anticipation for the G-20 summit (for its trade war implications specifically) is building. In this thematic dead zone, the stretched position for speculators is laid bare. Is there enough fundamental backing for the recent gains for bulls to hold to or did momentum play a greater role in recent performance than genuine conviction? There was a broad reversal in risk-leaning assets through the past session from global indices to emerging market assets. For many markets and their respective benchmarks, the correction doesn't seem particularly loaded. That isn't the case for the S&P 500 and Dow Average. Having crested record highs, any subsequent development carries far greater meaning than perhaps is intended. Which milestone you use for your assessment of next steps - say S&P 500 or global yields - will likely color your expectations for market performance moving forward. Choose wisely.
Chart of 9-Month Performance of S&P 500, Emerging Markets, Global Equities, Commodities (Daily)
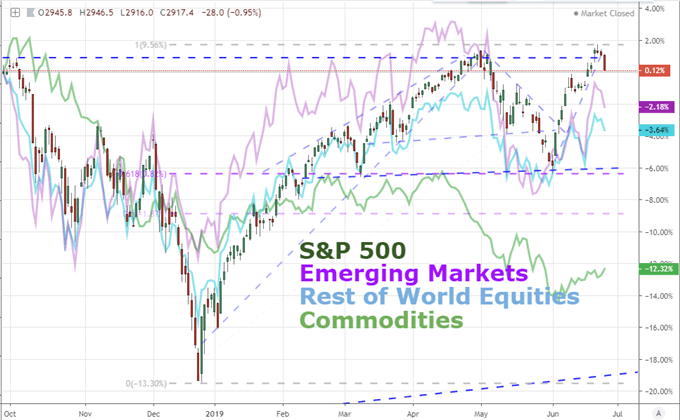
If we are looking to determine a tepid correction through stretched speculative positioning from the likes of the S&P 500 from a full-blown reversal, we should expect to find some reliable charge to fuel conviction. For the US indices, there was a significant scale of retreat this past session (the biggest drop since May 31st), but that seems to be more the product of a restrained climb in the preceding weeks than a full-blown retreat through Tuesday's session. A closer look at the slump, that accounts for the stretched nature of certain pace-setters, suggests there is perhaps not the same level of committed deleveraging that falls outside the influence of those particularly stretched measures. Whether, we refer to the rest-of-world equity ETF (VEU), the EEM emerging market product or carry trade; there is nowhere near the sense of over-extended exposure as what we are registering for the benchmark US indices. It is always possible that an unexpected fundamental wind arises through geopolitical fallout or GDP seizure, but that is not something to bank on for a committed tumble for a benchmark like the Dow. Then again, diverting from record highs with meaningful support not coming into view until much lower can still foster range opportunities where reversals fall short.
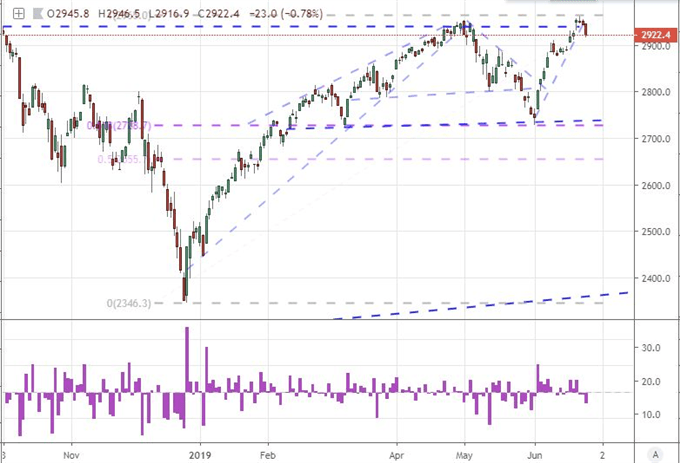
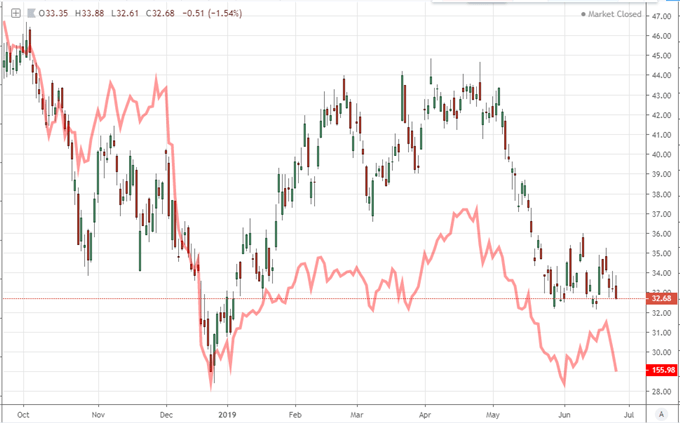
Chart of S&P 500 and 1-Day Rate of Change (Daily)
Dollar and Gold Are Not Responding to Risk But A Common Underlying Driver
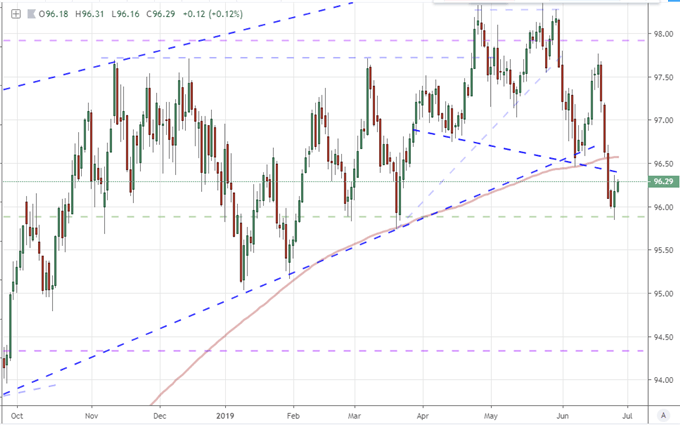
As risk measures topple, it is tempting to bundle similarly abrupt reversals under the same umbrella of influence. However, when we misattribute a significant market move to the improper underlying motivation, we are naturally ill prepared for subsequent movements. One such disconnected move that seems to correlate to the slump in equities is the turn in the DXY Index and other Dollar measures. The Greenback unmistakably put in for its first advance in five trading days Tuesday. That turn would not be so noticeable if it weren't for the fact that the preceding dive crashed through the floor of a 13-month rising trend channel support, the 200-day moving average and a possible 'neckline' to a drawn-out head-and-shoulders pattern. We could misinterpret the correction as a facile response from a safe haven asset, but the truth is more fulfilling. With the Fed's influence from this past Wednesday rate decision flagging, the artificial lift from external policy support eases underneath risk benchmarks, but it also curbs the pressure on the Dollar's fall from 'rate advantage' grace. If the theme tempers, a measure like the DXY may very well hover just below a critical technical milestone. Then again, there are pairs like the USDCHF which could take advantage of a directionless benchmark.
Chart of Dollar Index and 200-Day Moving Average (Daily)
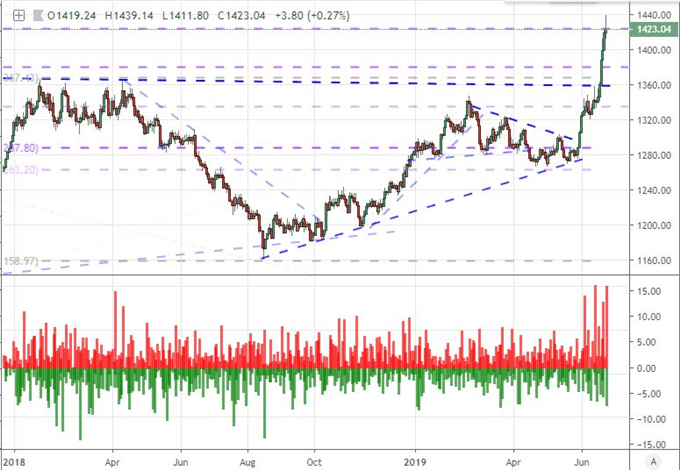
Another market leader that draws connection to recent developments outside of the traditional 'risk' cycle is gold. The precious metal managed to squeeze out a sixth consecutive gain through Tuesday's close. It doesn't mark the longest run in recent history, but the more-than 6 percent climb is exceptional. This past session's gains were significantly smaller than previous day's progress which already draws attention. In technical terms, the struggle occurs around the midpoint of the October 2012 to November 2015 slide. The intraday tail (or 'wick') that resulted from the about-face furthers a forest of significant interim corrections that speaks to growing volatility. The fundamental swell behind the precious metal is unmistakably the uniform devaluation of the major currencies which is far from resolved. Yet, here too, the commanding influence of the US central bank's policy efforts matters, which gives leverage to headlines that signaled moderation from Chairman Jerome Powell and committed-dove James Bullard who argued against over-reacting to short-term sentiment swings and the wisdom of a 50 basis point cut respectively.
Chart of Gold and Daily ‘Tails’ (Daily)
Political Risks That Venture Into Economics and Always Tying Back to GDP
As we move beyond the reach of monetary policy (until the next focused update) and we await the resolution on trade wars from the world's largest economies at the scheduled Summit, there is still considerable potential for unexpected developments to sweep across the landscape. Even trade wars has its secondary venues to monitor. Tuesday headlines warned that three major Chinese banks may be under review by American authorities for dealing with North Korea - possible pretense to leverage pressure before the Trump-Xi discussions. Further, after the New York close this past session, there was some acute volatility through afterhours trade of Micron Technology and Fedex, two companies with direct exposure to ongoing trade wars. The former managed to beat consensus forecasts of a $0.79 EPS (earnings per share) with a $1.05 performance despite 13 percent of revenues attached to blacklisted Chinese firm Huawei. There were no caveats to the shipping logistics firm which announced it was suing the US government over its attempt to control exports.
Chart of Micron Technology and Fedex Regular Hours (Daily)
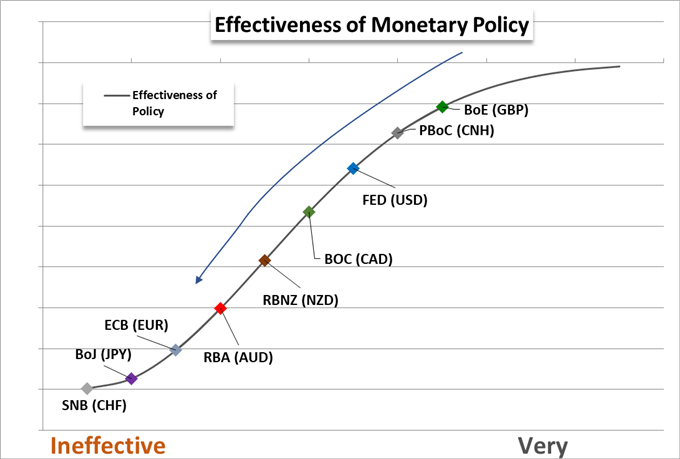
As we measure the ebb and flow of monetary policy and trade war influence, it is important to remember these are means to an end. The catalysts will ultimately manifest in genuine economic activity and speculative repositioning. Trade wars continue to eat away at the growth potential that benefited so demonstrably from the expansive efforts of the world's largest central banks. The reports that US consumer confidence took a dive this past month through the Conference Board's survey amplifies the reports from businesses lobbying the White House this past week to turn away from its trade fight. The more tangible the collapse of economic health becomes, the sharper the collapse in effectiveness of monetary policy grows - perhaps the only deep well of potential recovery left.
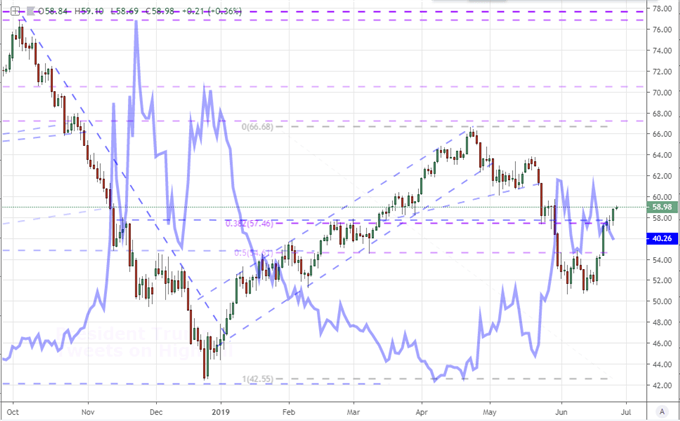
Another variable outlet of far-reaching influence to monitor in this transitional period is the growing weight of political risk. Much of the attention remains on the war-of-words between Iran and the United States - and rightfully so. Wars between Middle Eastern countries and the world's largest military is familiar prose these past decades. This past session, the Iranian Deputy Foreign Minister said there was no reason to carry on with the nuclear deal unilaterally while President Trump responded to "insulting" remarks by warning "overwhelming force" would be used in response to any attacks on US assets. For its part, WTI crude oil was forging a moderate advance this past session. This is a good barometer for this particular front, more so for its gauge of intensity rather than a simple assessment of improvement or deterioration. And, while this particular story tends to override many other concerns, reports that the US President is considering the end of support for the Japanese defense treaty for cost concerns should not be overlooked.
Chart of US Crude Oil and CBOE Oil Volatility Index (Daily)
If you want to download my Manic-Crisis calendar, you can find the updated file here.


