


Risk Trends Talking Points:
- There are numerous places in the speculative markets that are on the verge of a break, but S&P 500 and Dow shape clear H&S patterns
- Trade wars, European elections, Brexit squabbling and recession concerns continued to gnaw at the the market's stability
- As the Dollar continues to defy its traditional lines and Euro weighs systemic issues, pay special attention to CAD, AUD and Silver
See what live coverage is scheduled to cover key event risk for the FX and capital markets on the DailyFX Webinar Calendar.
A Return of Liquidity and the Staging of More Speculative Threats
The US and UK markets were back online following an extended holiday weekend. Speculative tempo certainly picked up Tuesday alongside volumes, but the deeper liquidity wouldn't resolve the convenient ignorance to systemic fundamental threats nor the tense technical patterns that have formed on some key benchmarks for the global markets. Following an opening gap higher for many of the weather beacons across the globe, risk assets took a noticeable and uniform dive through the end of Tuesday's trading session. There were varying degrees of pressure behind the bearish intent on the day, but it would show clearly throughout the system via global shares (ACWI), emerging markets (EEM), commodities, yields and carry trade (USDJPY). While the level of loaded premium for most of these milestones is not nearly as high as US indices, there is still a clear risk of further losses moving forward if properly prompted. And, while we should absolutely monitor the fundamental charges, it is important not to write off the impact that a technical 'accident' can incur. With benchmarks like the DAX German equity index working its way into a 'break of necessity', these developments can act as a sheer speculative spark should the tinder be dry enough.
Chart of DAX Index (Daily)

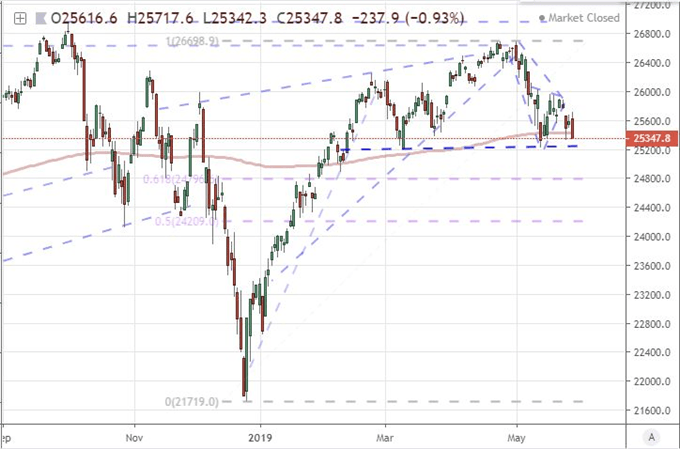
As many interesting technical patterns as there are out there, the most potent in my estimation of the market's standing is to be found in the benchmark US equity indices. The Dow Jones Industrial Average and S&P 500 have carved out overt head-and-shoulders patterns. These are traditionally reversal chart figures. That is not to say that the markets must turn simply because there is price action that looks close to what we can find in the textbooks, but it suggests the proper staging should the other elements align. The high, higher high and lower high is the least important aspect of this formation. The 'neckline' support being so overt at 25,200 for the Dow and 2,800 on the S&P 500 are more material. Further, this consolidation pattern has established itself for the latter in the midst of failing to make progress on short-lived record high drive. Far more material is the lead in to the congestion. So much focus is put on the H&S pattern itself, but the critical part is the clear trend that precedes it. The more aggressive - faster and longer - the drive is, the more likely it is to stoke misalignment and a contrarian reversal. The 1Q rally was a charged reversal of the preceding quarter's losses and clearly sets the stage for a more dedicated tumble. Further context outside the clarity of these leading benchmarks' patterns and the ubiquity of a sentiment theme across assets is the loaded fundamental state. Overlooking trouble or proactively trying to fight it is far harder to do when all of these factors come together.
Chart of Dow Jones Industrial Average (Daily)
Trade Wars, Political Fissures and Recession Warnings Pick Up
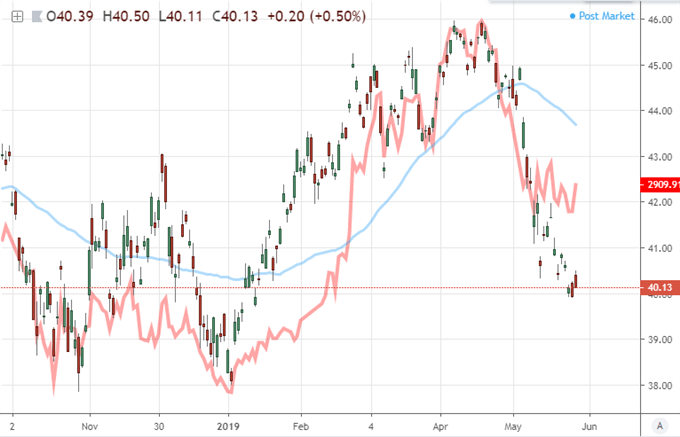
For fundamental drum beats, there are many of the familiar baselines that we have heard over the past months. Top billing remains trade wars - particularly between the United States and China. Though we haven't seen an increase in their respective tariff lists or the rate at which they are taxing goods at the border, the mood has clearly continued to deteriorate. President Trump in Japan said they are not ready to make a deal with China while a Xinhua story made clear that America's demands were contradictory to their "core interests", which is to say they will not budge on key issues. Meanwhile, the talk of Apple as a course of retaliation eased to the backdrop while and there were far more stories about why China wouldn't use Treasuries as a tool, but a new track of speculation is that the country may use its holdings of US equities to exert pressure. USDCNH put in for its first advance in six trading days while the FXI and Shanghai Composite continue to paint disparate pictures of the pressure on the country's markets. News that China seized its first bank in two decades and industrial profits dropped 3.7 percent last month add to concern already stoked by the growing list of reports reflecting a higher bill for Americans as the war continues.
Chart of FXI China ETF and Shanghai Composite in Red (Daily)
Political risk was another news-directed theme to kick off the trading week. Of course, we are still dealing with the barbs traded between the United States and Iran along with a few other newsworthy fronts, but the real development was in Europe's landscape. The EU Parliamentary elections through Sunday confirmed the populist/nationalist gains that were projected in opinion polls and through previous, isolated votes in other areas around the world. While the most overt anti-EU parties didn't gain as much traction as was hoped/feared, there was a notable shift away from the center-right and center-left parties - those groups more likely to find compromise. The long-term risks to the Euro's stability pushed to the side for a moment, this is a global concern as the capacity for the world's governments to work together should conditions warrant - or even demand - it is as troubled as we have seen it in some time. Let's just hope there isn't a crisis to put this 'my country first' mentality to the test.
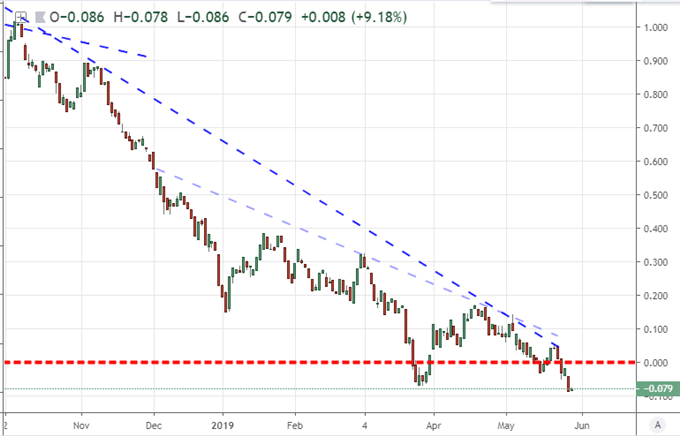
If there were a critical trial for the world's health against a backdrop of questionable collaboration, it would likely come through traditional economic pain. Growth concerns were clearly on the mind between the stories of the US and China struggling under the trade war, but the report from Fitch Ratings on the threat posed by the global slowdown in the auto market puts a more defined face on the outlet for trouble. And, proving there is a chart for everything, the US 10-year to 3-month yield spread was again floating up to the top of the market headlines Tuesday when the spread's inversion dove to its lowest point (-0.09 percent or 9 basis points) in a decade. That doesn't make a recession any more certain, but it sure does call a lot of attention to a market where record high equities dramatically contrasts to the questionable fundamental backdrop.
Chart of US 10-Year and 3-Month Treasury Yield Spread (Daily)
The Vague Risks in Euro and Pound Contrast the Distinct Volatility Even for the Canadian Dollar
Looking to specific regional and asset risks, there are plenty of ambiguous backdrops that make for difficult trading conditions moving forward. The Dollar is perhaps one of the more difficult currencies to draw a line on. Clearly the world's most liquid currency is deviating from its haven role as implied volatility is holding back and the implied yield forecast from Fed Funds futures are at their lowest levels since December 2017. Where is it garnering its traction - proximity to two-year highs? The struggle of its principle counterparts. The Euro is more oppressive with its fundamental backdrop, but even that is murky. The EU Parliamentary elections are more of an existential but distant threat to the currency's 'number two reserve' status. The tension brought on by Italy's fiscal clash with the European Community is a little more pointed. Deputy Prime Minister Salvini warned this past session that the EC could potentially hit the country with a fine up to 3 billion euros for its refusal to comply to budget limits. Watch the Italian-German yield spread on this point.
Chart of Italian-German 10-Year Yield Spread with Opening Gaps and EURUSD in Red (Daily)
The Sterling is another currency that is feeding Dollar appetite through its own sacrifice. The outcome from the EU elections left the UK with a strong Brexit Party win, impressive considering the party only recently came into existence through the frustration from the ruling parties. Add that to the jostling to replace Theresa May as the head of the Conservative Party (and PM) on June 7th by preaching a greater willingness to use the 'no deal' option, and it is reasonable to expect the Pound to remain under pressure - though not constantly.
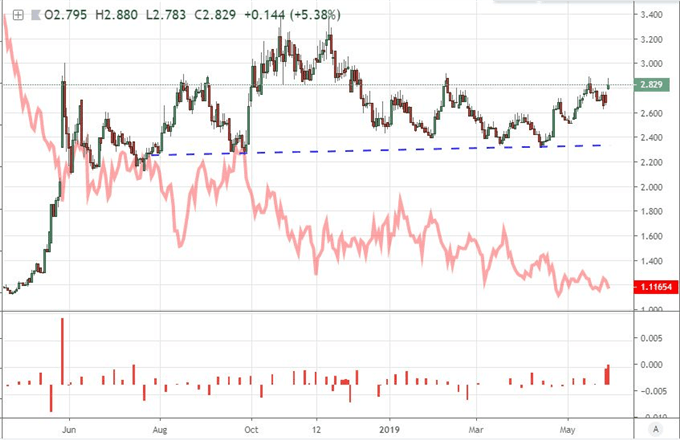
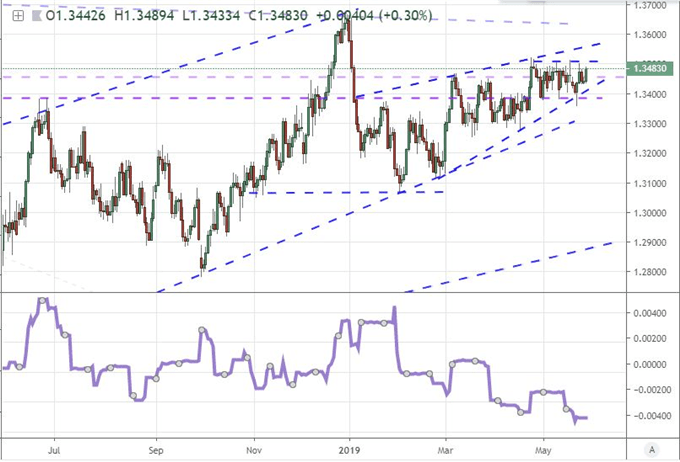
For a less disconnected fundamental picture (and certainly a contrast to the external guides for influence), the Canadian Dollar is going to carry a very loaded combination of circumstances over the coming 24 hours. In terms of current conditions, the USDCAD has carved out one of its most inactive periods of trade in recent history. The 20-day average true range (ATR) is the lowest since the extreme Summer of 2014. Even more exceptional is the fact that the historical range on the pair over that same one-trading-month period established the smallest trading area going back to 1997. These are prime conditions for a break and the proper catalyst could do some serious damage here. How about the Bank of Canada rate decision on tap Wednesday? Another atypical area of the market to highlight is the precious metals. Rather than reflect more on Gold's moderate capitulation to the Dollar as a pricing interest, consider the incredible climb in the Gold-Silver ratio which is scaling heights we have not seen since March 1993. We discuss all of this and more in today's Trading Video.
Chart of USDCAD and 20-Day Historical Range (Daily)
If you want to download my Manic-Crisis calendar, you can find the updated file here.


