


Risk TrendsTalking Points:
- The S&P 500 briefly ventured above a 5-month range high at 2815 but market environment and Boeing sympathy cut the run short
- UK's Parliament voted to avoid a no-deal Brexit but uncertainty persists - a consideration for GBPUSD traders as the pair nears 1.3400
- The Dollar's worst drop in six weeks and longest slide (matching) since August was not a move of the currency's own making
See how retail traders are positioning with these critical technical moves in EURUSD, the Dow, gold and other key markets on an intraday basis using the DailyFX speculative positioning data on the sentiment page.
S&P 500 Lines Up a Technical Pattern Markets Can't Live Up To
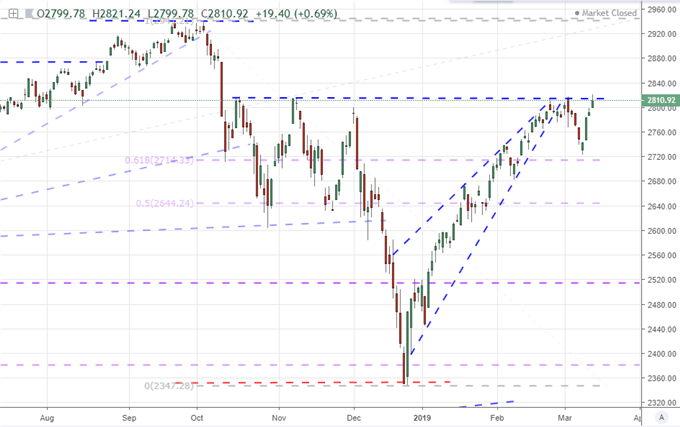
Markets are sending mixed signals. On the one hand, we have implied (expected) volatility readings settling into levels associated to general inactivity while most risk assets are showing little initiative for returning to their once-robust trends. And, then there are the few benchmarks that seem to defy the convention with ambitious runs and provocative technical setups. One of the most impressive setups comes from the S&P 500. Following the robust two-month rally to reverse much of its fourth quarter losses, the bell whether has solidified significant resistance in 2815 with multiple spaced tests - and rejections - dating back to October.
This past session, the index found itself briefly above the technical waterline until an afternoon slip capped bulls' ambitions. A break is difficult enough to earn, but the natural expectations of follow through deserve thorough skepticism. Systemic themes are the greatest source for momentum as they can rouse the most comprehensive participation from the markets. Trade war fears are still set to their lowest gear and it seems there is little relief rally left to wring in bulls' favor. Further, President Trump's seeming confirmation this past session that Chinese officials have reason to fear that the US could still walk away from the deal the two countries are working out will prevent any serious enthusiasm from reaching beyond the natural capacity of this recovery.
Meanwhile, hope for monetary policy to restore the heyday of speculative reach is clearly misplaced as the limitations are more obvious than any market-based benefits. Remember that for the Bank of Japan (BOJ) rate decision ahead. Then there is traditional growth. When the speculative fog clears, we are left with the brass tacks of economic potential; and that should worry us. China has been a highlight on the economic front this week with the dramatic decline in financing and loans Monday which sets up the important run of February economic data Thursday (retail sales, jobs, fixed assets, industrial production and property).
Chart of S&P 500 (Daily)
GBPUSD Levels Up to Resistance After No-Deal Vote
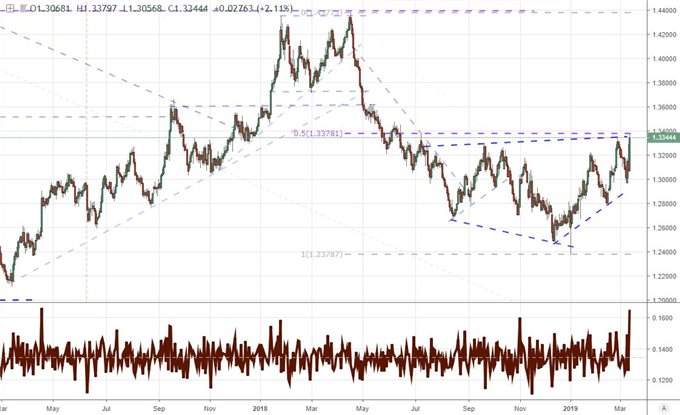
Another trader favorite that is attempting to defy the general state of the market is GBPUSD. This week has proven exceptionally volatile for the cross. The five-day average true range or ATR (a measure of price-based volatility) hit its highest level since January 2017. This past session's rally alone was the biggest single-day's gain since April 18, 2017. That particular move would also position the pair at a very pronounced technical resistance. Just below 1.3400 we are met with a prominent trendline resistance and the midpoint of the April 2018 to January 2019 bear wave. This is certainly a loaded view for technical traders, but will we catalyze the breakout and follow through? To answer that question, we must establish motivation.
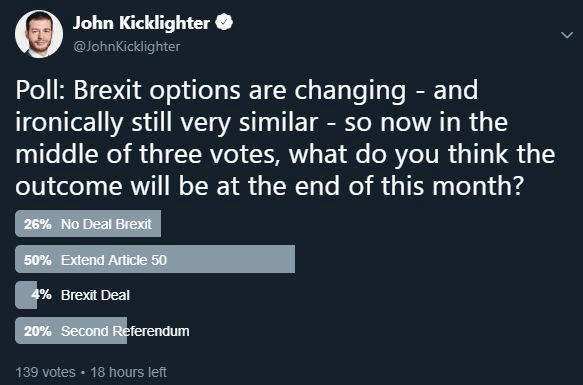
The Sterling is the principal driver for the Cable's performance lately. We can see the same drama in other Pound crosses such as EURGBP, GBPJPY and GBPCAD - along with the same lack of commitment to follow through. It should come as no surprise that Brexit is the spark for errant volatility that we are experiencing just as it has acted as anchor through the past months and years. Tuesday, Parliament voted resoundingly to reject Prime Minister Theresa May's most recent Brexit proposal. That in turn led to this past session's vote: whether a 'no deal' Brexit will be considered an option. As expected, the disruptive scenario was rejected by 312 to 278. Fundamentally, that reduces the perceived risk in the ultimate outcome to this long-running divorce. That said, uncertainty remains.
Today, a third vote will be taken up determining whether to request a delay on Article 50. May warned after the most recent vote that a delay will not change the circumstances of what the EU would approve and repeated her warning that a second referendum could lead to 'no Brexit at all'. With that in mind, a third 'meaningful vote' seems to have been added to the calendar for next week. While this seems to suggest a deal or second referendum (both potentially supportive for the Sterling) are rising probabilities, anticipation will maintain anxiety until a path is clear.
Chart of GBPUSD and 1-Day Rate of Change (Daily)
A Four-Day Dollar Slide and Crude Oil's Break and Yen Fundamentals With Limited Capacity
Another active currency this week with even less promise for productive follow through is the US Dollar. The DXY Dollar Index has dropped four consecutive trading days through Tuesday's close - matching the longest bearish stretch since August 22. There are always fundamentals at play, but is this a move born out of the traditional themes? This past session offered up factory inflation, construction spending and durable goods figures. The latter two were generally positive while the upstream inflation figure offered little clarification on the debate as to whether the Fed will hike or cut rates this year. To some extent, the recent swing looks to be a function of speculative appetites swinging comfortably within a well-worn range. Another contribution seems to be the Dollar's collective counterpart roll. The Pound has overtaken the Euro has principal counter-lever, which could make its drive just as restricted as the Sterling's.
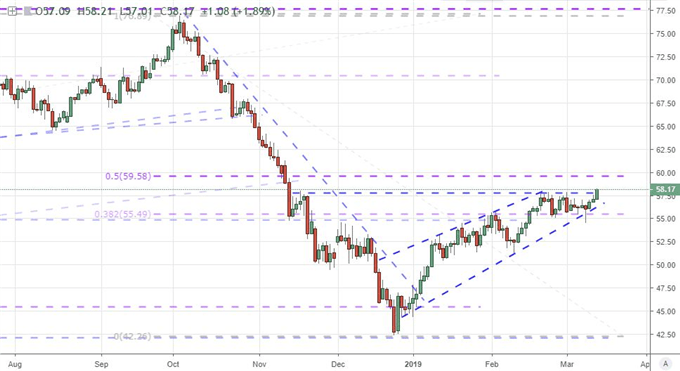
If you are looking for a market making - rather than staging - a breakout, US-based WTI crude oil has finally overtaken a seemingly firm resistance at 57.85. Reports by the EIA of a draw on inventories and forecasted production cut can earn a break, but supply side factors are proving notoriously incapable of carrying a bull trend. That seems to be the responsibility of demand which finds little traction against a backdrop of fading growth forecasts. As such, what should we expect from this commodity break?
For fundamental potential, traders should keep an eye out to the near future as the BOJ will likely deliver another very dovish assessment in its monetary policy decision. That is not likely to include any new accommodation efforts nor is it likely to manipulate the Yen's course. However, the implications for uneven risk trends to be reminded that central banks are increasingly worried about the outlook while showing their lack of capacity to fight any future fires are worrying. We discuss all of this and more in today's Trading Video.
Chart of US Crude Oil Prices (Daily)
If you want to download my Manic-Crisis calendar, you can find the updated file here.


