


Gold Technical Price Forecast: XAU/USD Weekly Trade Levels
- Gold price updated trade levels - Weekly Technical Chart
- XAU/USD rebound trading into yearly downtrend resistance; 1671-1762 range breakout in focus
- Get started with this Free How to Trade Gold -Beginners Guide s
Gold prices rallied more than 2.7% off the monthly low with XAU/USD trading into a tight range just below yearly channel resistance. The battle lines are drawn heading into key US inflation data tomorrow and while the broader technical threat remains lower, we’re looking for possible inflection into a critical support pivot with well-defined range breakout likely to offer some clarity in the days ahead. These are the updated targets and invalidation levels that matter on the XAU/USD weekly chart. Review my latest Weekly Strategy Webinar for an in-depth breakdown of this gold technical setup and more.
Gold Price Chart - XAU/USD Weekly

Chart Prepared by Michael Boutros, Technical Strategist; Gold on Tradingview
Notes: In last month’s Gold Weekly PriceOutlook we noted that the XAU/USD, “recovery off downtrend support is now testing downtrend resistance- looking for a reaction / price inflection up here in the days ahead.” The high was registered at channel resistance that week before reversing sharply lower with a three-week decline plunging more than 6.5% off the August high.
The decline has been unable to close below the 1.618% extension of the yearly decline at 1706 with critical support steady at 1671/82- a region defined by the May / June 2020 lows, the 2021 lows and the 38.2% retracement of the 2015 advance. A break below this level would be extremely damaging from a technical standpoint with such a scenario exposing the 2020 March reversal close at 1631 and the 50% retracement at 1560.
Initial weekly resistance eyed at the August 15th weekly reversal close at 1745 backed closely by the 2018 / 2019 trendline / 61.8% Fibonacci retracement of the recent decline at 1762- a weekly close above this threshold is needed to suggest a more significant recovery is underway / shift the medium-term focus higher again towards the January low-week close at 1791 and beyond.

Bottom line: Gold is trading just below yearly channel resistance and the broader focus is a breakout of the 1671-1762 range for guidance. From a trading standpoint, while the threat remains for a test of key support just lower, respect the break of this medium-term range. Ultimately, gold is testing a major technical pivot zone here – be patient and stay nimble. I’ll publish an updated Gold Price Short-term Technical Outlook once we get further clarity on the near-term XAU/USD trade levels.
For a complete breakdown of Michael’s trading strategy, review his Foundations of Technical Analysis series on Building a Trading Strategy
Gold Trader Sentiment – XAU/USD Price Chart
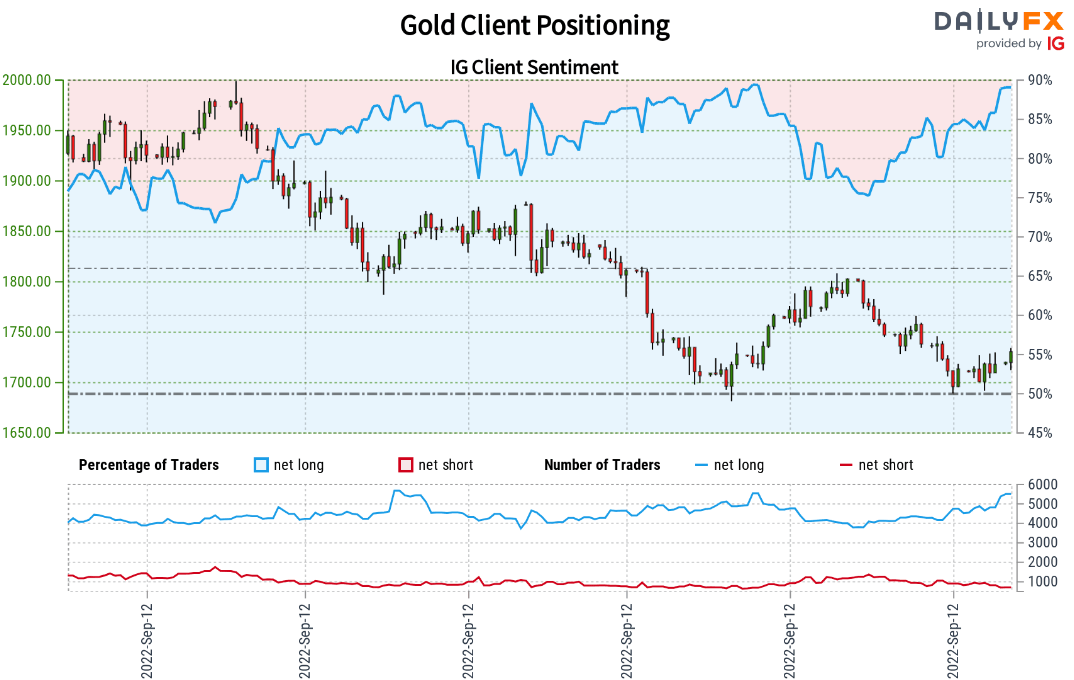
- A summary of IG Client Sentiment shows traders are net-long Gold- the ratio stands at +6.08 (85.88% of traders are long) – typically bearishreading
- Long positions are2.09% lower than yesterday and 13.35% higher from last week
- Short positions are 30.01% higher than yesterday and 2.95% lower from last week
- We typically take a contrarian view to crowd sentiment, and the fact traders are net-long suggests Gold prices may continue to fall. Traders are less net-long than yesterday but more net-long from last week. The combination of current positioning and recent changes gives us a further mixed Gold trading bias from a sentiment standpoint.
| Change in | Longs | Shorts | OI |
| Daily | 3% | -5% | -1% |
| Weekly | 12% | 3% | 7% |
---
Active Weekly Technical Charts
- S&P 500, Nasdaq & Dow
- Canadian Dollar (USD/CAD)
- Japanese Yen (USD/JPY)
- US Dollar Index (DXY)
- Euro (EUR/USD)
- Crude Oil (WTI)
- British Pound (GBP/USD)
- Written by Michael Boutros, Technical Strategist with DailyFX
Follow Michael on Twitter @MBForex


