


Gold Price Outlook:
- Gold prices have dropped for four consecutive days in the wake of Fed Chair Jerome Powell’s speech at the Jackson Hole Economic Policy Symposium.
- The US 10-year real yield is at its highest level since the end of July, which is eroding gold’s appeal.
- According to the IG Client Sentiment Index, gold prices have a mixed bias in the near-term.

The Albatross is Back
Gold prices have been struggling in the wake of Fed Chair Jerome Powell’s speech on Friday. As observed in the weekly gold price forecast, “rising sovereign bond yields (not limited to US Treasury yields) and a decline in inflation expectations across developed economies, curating a push higher in real yields globally. If real yields continue to climb, then gold prices will face more difficult trading conditions in the immediate future.” This is exactly what’s transpired this week, with the US 10-year real yield at +54-bps, its highest level since late-July. In a sense, the interest rate albatross is back around gold’s neck.
Gold Volatility Rebounds, Gold Prices Drop Further
Historically, gold prices have a relationship with volatility unlike other asset classes. While other asset classes like bonds and stocks don’t like increased volatility – signaling greater uncertainty around cash flows, dividends, coupon payments, etc. – gold tends to benefit during periods of higher volatility. Gold volatility is rising, but in context of the higher yields and a stronger US Dollar, its proving a headwind for gold prices in the near-term.
GVZ (Gold Volatility) Technical Analysis: Daily Price Chart (August 2021 to August 2022) (Chart 1)
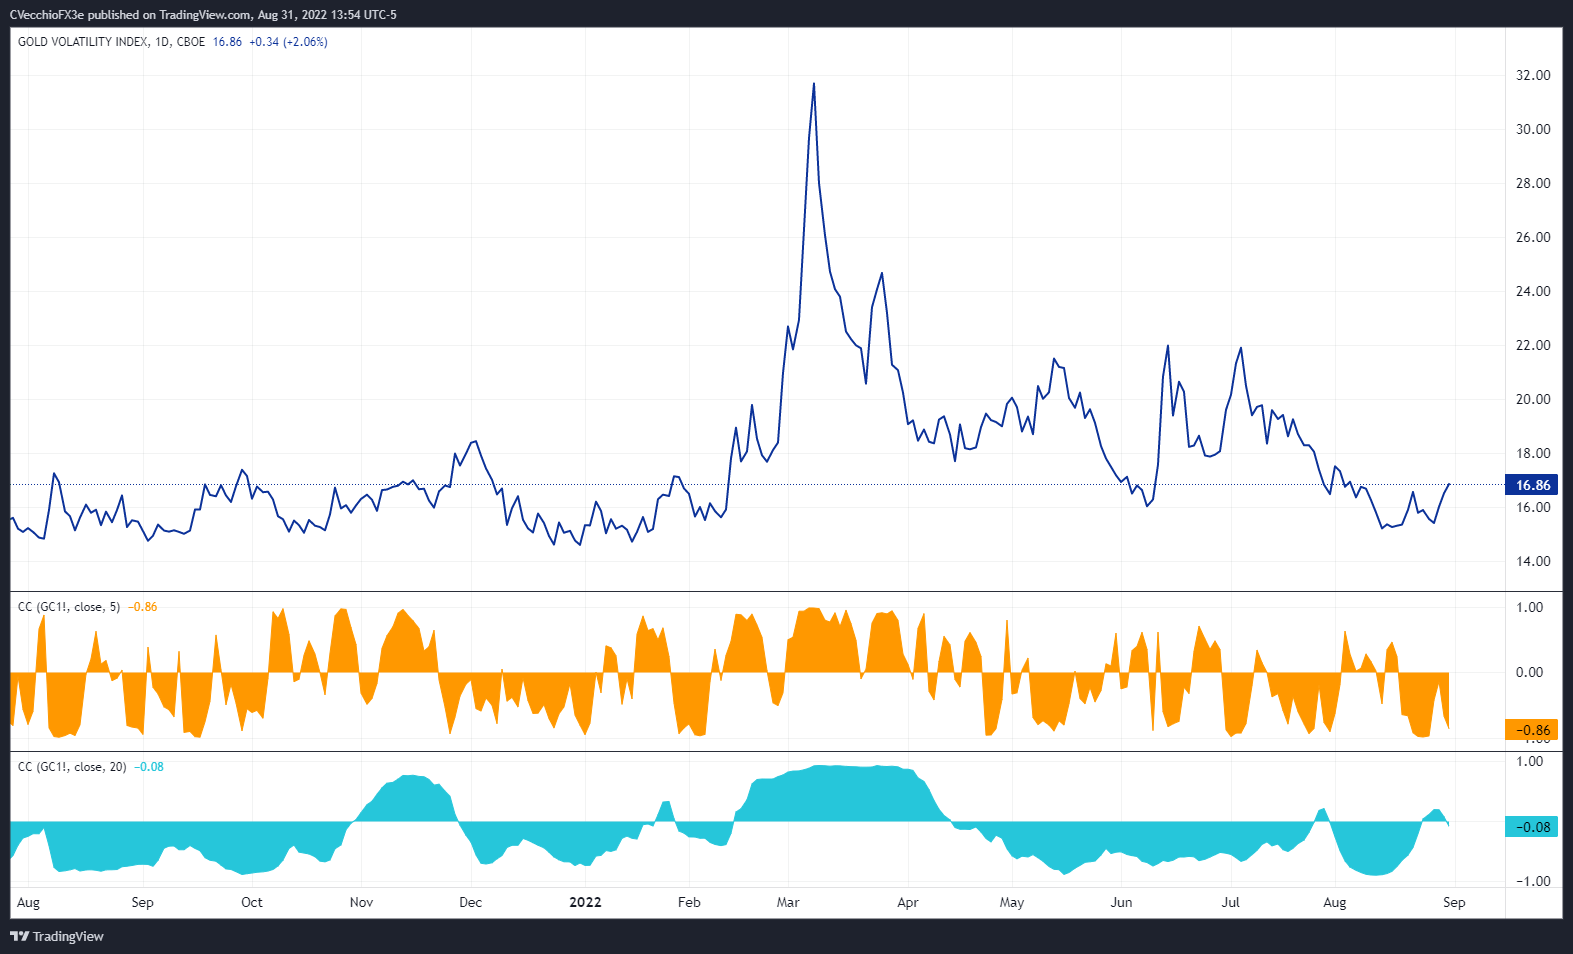
Gold volatility (as measured by the Cboe’s gold volatility ETF, GVZ, which tracks the 1-month implied volatility of gold as derived from the GLD option chain) was trading at 16.86 at the time this report was written. The 5-day correlation between GVZ and gold prices is -0.86 while the 20-day correlation is +0.08. One week ago, on August 24, the 5-day correlation was -0.99 and the 20-day correlation was -0.04.
Gold Price Rate Technical Analysis: Daily Chart (August 2021 to August 2022) (Chart 2)
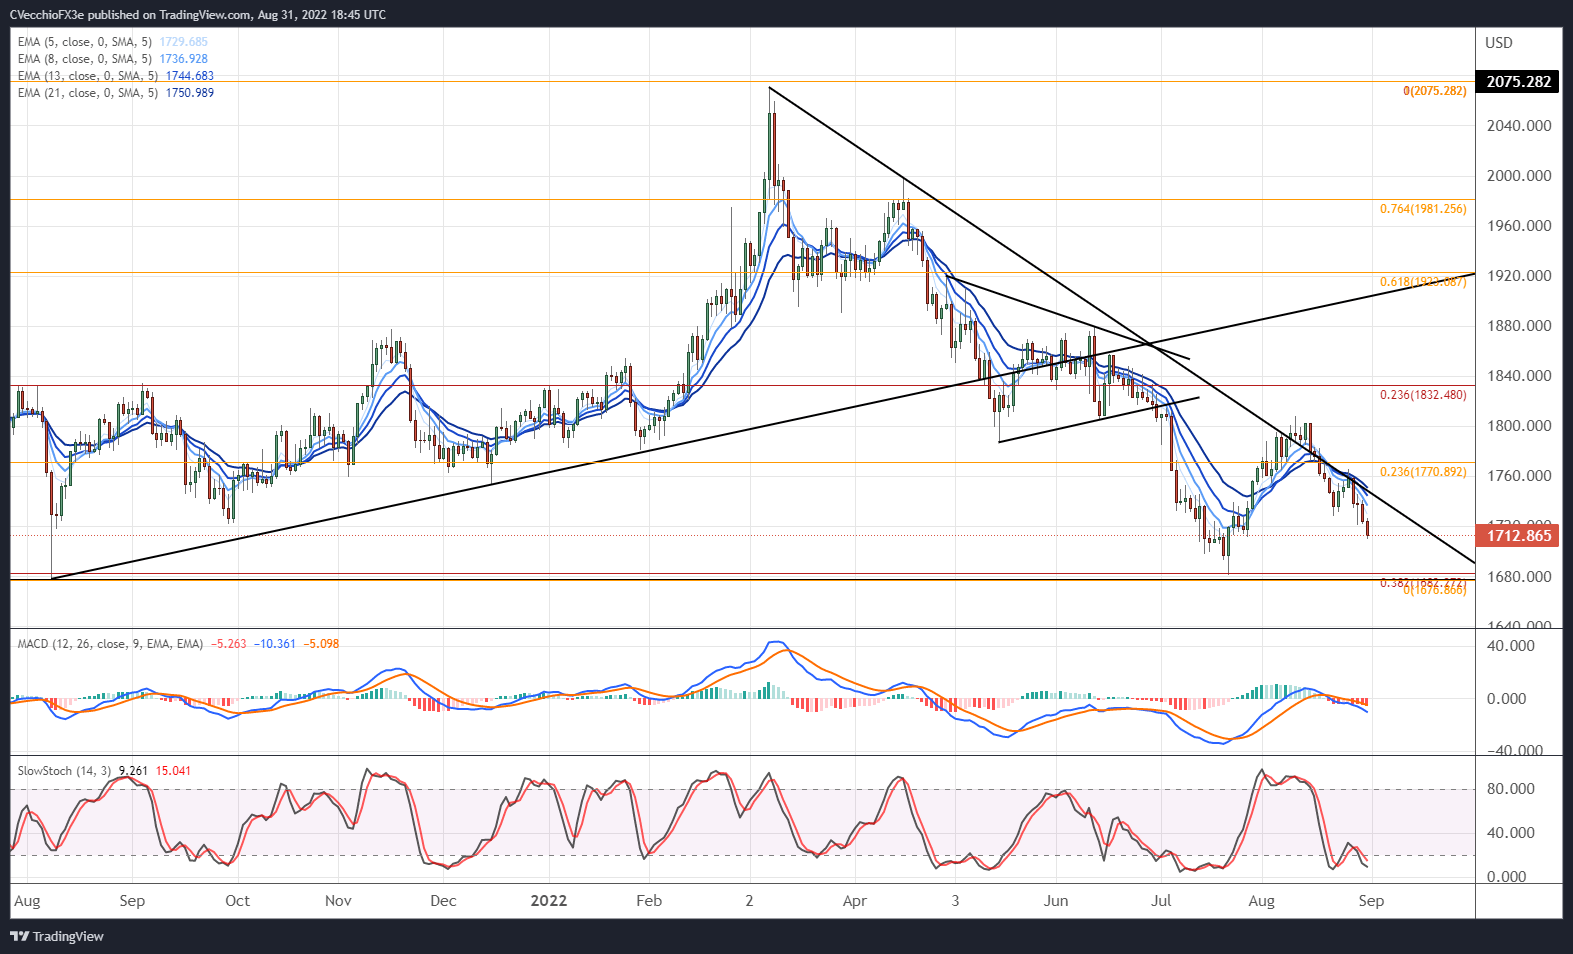
Last week it was noted that “resolution around the multi-month descending trendline, sparked by Fed Chair Powell’s Jackson Hole speech, will help clarify the near-term trading bias: either back towards the August high at 1807.96; or back to the yearly low at 1680.94.”
Momentum has since deteriorated, with gold prices below their daily 5-, 8-, 13-, and 21-EMAs, and the EMA envelope remains in bearish sequential order. Daily MACD is trending lower below its signal line, although daily Slow Stochastics have reentered oversold territory. It appears that the bias is to the downside towards the yearly lows as gold prices have rapidly sunk below the descending trendline from the March and April swing highs.
Gold Price Technical Analysis: Weekly Chart (October 2015 to August 2022) (Chart 3)
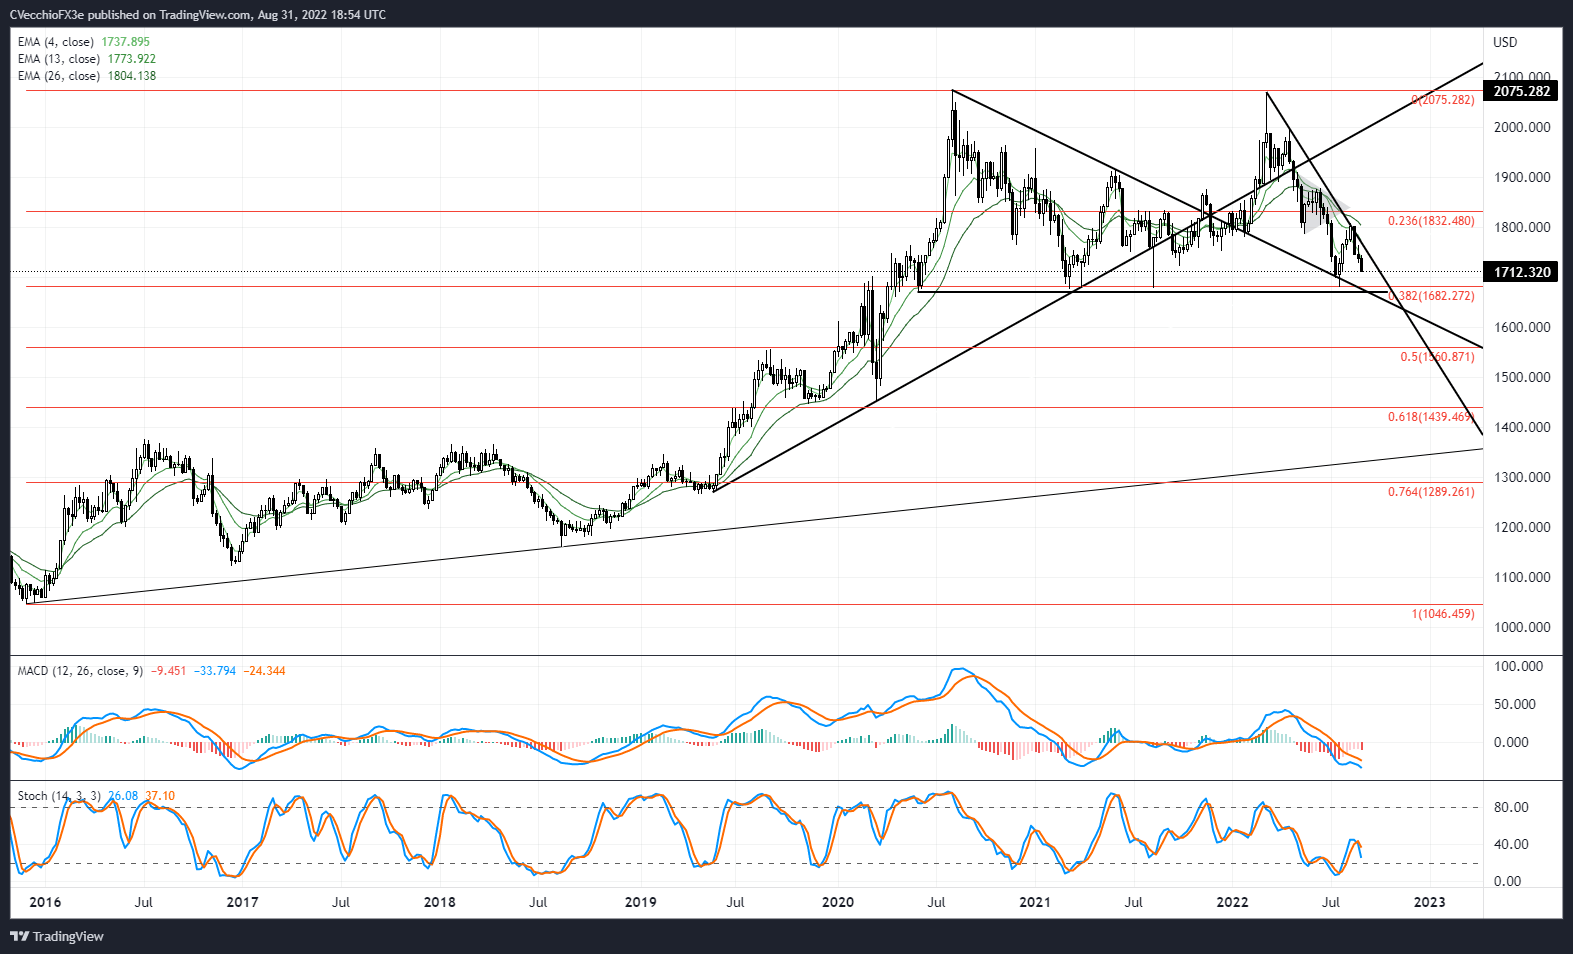
The longer-term view remains unchanged: “a double top remains in place, but a quadruple bottom around 1680 warrants a reconsideration: a massive sideways range between 1680 and 2075 may have formed. A bounce from 1680 sees 1800 as the first area before resistance is found. The sudden shift in the environment suggests that the daily timeframe (and lower, like the 4-hour timeframe) will be better suited to pay attention to over the coming days/weeks as it will take a long time for technical indicators to evolve on the weekly timeframe.”

IG CLIENT SENTIMENT INDEX: GOLD PRICE FORECAST (August 31, 2022) (Chart 4)
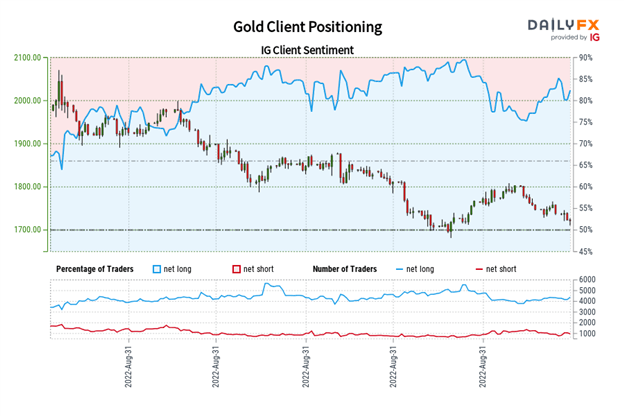
Gold: Retail trader data shows 83.25% of traders are net-long with the ratio of traders long to short at 4.97 to 1. The number of traders net-long is 4.11% higher than yesterday and 2.01% higher from last week, while the number of traders net-short is 13.44% lower than yesterday and 7.06% lower from last week.
We typically take a contrarian view to crowd sentiment, and the fact traders are net-long suggests Gold prices may continue to fall.
Traders are further net-long than yesterday and last week, and the combination of current sentiment and recent changes gives us a stronger Gold-bearish contrarian trading bias.
Trade Smarter - Sign up for the DailyFX Newsletter
Receive timely and compelling market commentary from the DailyFX team
--- Written by Christopher Vecchio, CFA, Senior Strategist


