


Gold Price Outlook:
- Gold prices have reversed quickly in recent days amid a resurgent US Dollar and rising US Treasury and real yields.
- Fed Chair Jerome Powell’s speech at the Jackson Hole Economic Policy Symposium may help rekindle the perception of a hawkish central bank.
- According to the IG Client Sentiment Index, gold prices have a mixed bias in the near-term.

Fundamentals Turn into Headwind
Gold prices have been suffering at the hands of familiar fundamental foes from earlier this year: a resurgent US Dollar (via the DXY Index) and the combination of rising US Treasury yields and US real yields. In fact, over the past three weeks, the US 10-year real yield has moved up from 9-bps to 40-bps today; historically, rising US real yields are correlated with negative returns for gold prices.
With the Federal Reserve’s Jackson Hole Economic Policy Symposium later this week expected to bring forth an aggressive hawkish tone from Fed Chair Jerome Powell – if only to correct the market’s perception of the path of interest rate hikes in the wake of the July Fed meeting – gold prices may remain under pressure for the near-term time horizon.
Gold Volatility Rebounds, Gold Prices Drop
Historically, gold prices have a relationship with volatility unlike other asset classes. While other asset classes like bonds and stocks don’t like increased volatility – signaling greater uncertainty around cash flows, dividends, coupon payments, etc. – gold tends to benefit during periods of higher volatility. The drivers of the uptick in gold volatility – higher US Treasury and real yields and a stronger US Dollar – are doing no favors for gold prices, however.
GVZ (Gold Volatility) Technical Analysis: Daily Price Chart (August 2021 to August 2022) (Chart 1)

Gold volatility (as measured by the Cboe’s gold volatility ETF, GVZ, which tracks the 1-month implied volatility of gold as derived from the GLD option chain) was trading at 16.62 at the time this report was written. The 5-day correlation between GVZ and gold prices is -0.92 while the 20-day correlation is -0.44. One week ago, on August 15, the 5-day correlation was +0.34 and the 20-day correlation was -0.87.
Gold Price Rate Technical Analysis: Daily Chart (August 2021 to August 2022) (Chart 2)

Last Monday it was noted that “gold prices have reversed sharply, trading back into their EMA envelope and falling back to former resistance now support, the descending trendline from the March and April swing highs…a drop below the daily 21-EMA would constitute a failed bullish breakout, putting focus on the August low at 1754.35.” Gold prices closed below their daily 21-EMA on Wednesday, setting up the accelerated decline seen in recent days.
The momentum profile has turned bearish. Gold prices are below their daily 5-, 8-, 13-, and 21-EMA envelope, which is now in bearish sequential order. Daily MACD is falling through its signal line, while daily Slow Stochastics are back in oversold territory. A return to the yearly lows set around 1680 is not of the question, even though a significant bearish breakout appears unlikely in the near-term.
Gold Price Technical Analysis: Weekly Chart (October 2015 to August 2022) (Chart 3)
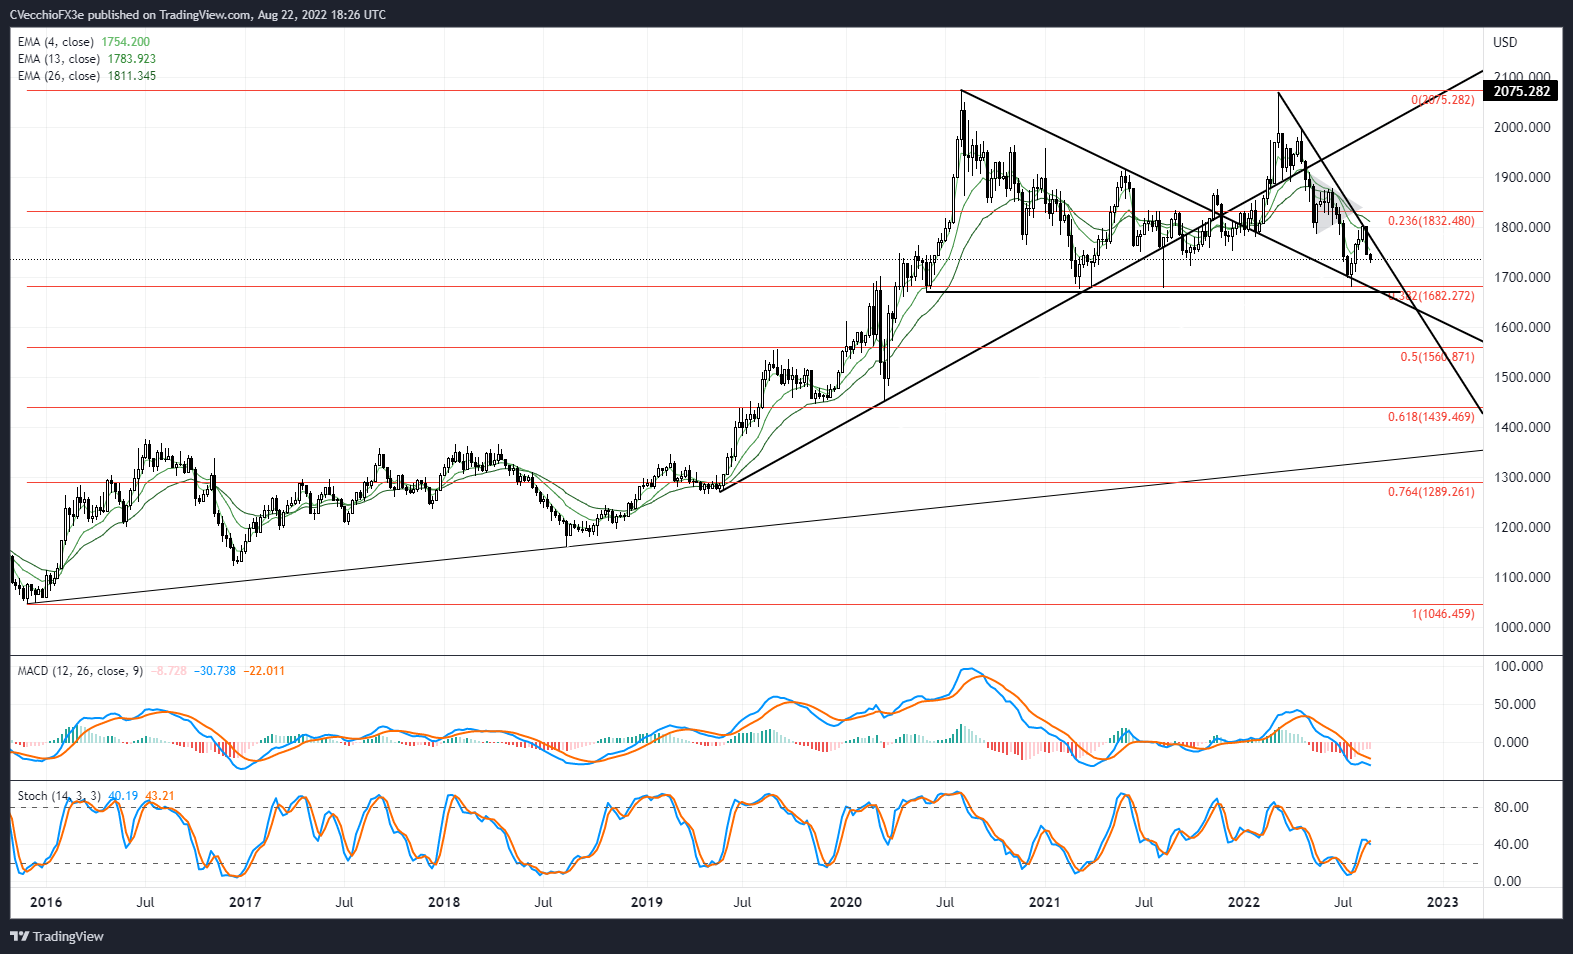
The longer-term view is unchanged: “a double top remains in place, but a quadruple bottom around 1680 warrants a reconsideration: a massive sideways range between 1680 and 2075 may have formed. A bounce from 1680 sees 1800 as the first area before resistance is found. The sudden shift in the environment suggests that the daily timeframe (and lower, like the 4-hour timeframe) will be better suited to pay attention to over the coming days/weeks as it will take a long time for technical indicators to evolve on the weekly timeframe.”

IG CLIENT SENTIMENT INDEX: GOLD PRICE FORECAST (August 22, 2022) (Chart 4)
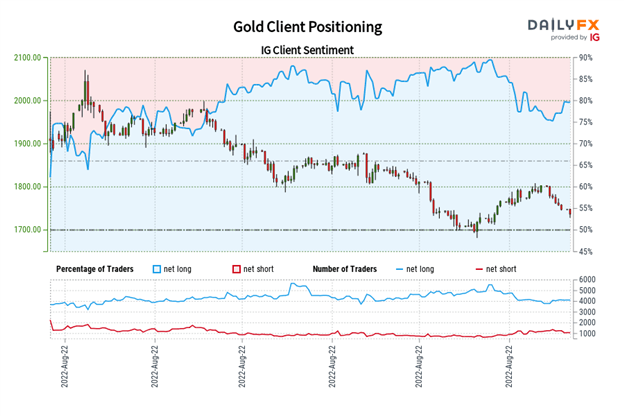
Gold: Retail trader data shows 79.08% of traders are net-long with the ratio of traders long to short at 3.78 to 1. The number of traders net-long is 0.58% higher than yesterday and 1.45% higher from last week, while the number of traders net-short is 4.19% higher than yesterday and 1.20% higher from last week.
We typically take a contrarian view to crowd sentiment, and the fact traders are net-long suggests Gold prices may continue to fall.
Positioning is less net-long than yesterday but more net-long from last week. The combination of current sentiment and recent changes gives us a further mixed Gold trading bias.
Trade Smarter - Sign up for the DailyFX Newsletter
Receive timely and compelling market commentary from the DailyFX team
--- Written by Christopher Vecchio, CFA, Senior Strategist


