


Gold Technical Price Outlook: XAU/USD Near-term Trade Levels
- Gold price updated technical trade levels – Daily & Intraday Charts
- XAU/USD breakout curbed by multi-week range- levels into April / Q2 open
- New to Gold Trading? Get started with this Free How to Trade Gold -Beginners Guide
Gold prices are contracting just below key resistance / just above uptrend support and the battle-lines are drawn heading into the April / Q2 open. These are the updated targets and invalidation levels that matter on the XAU/USD technical charts this week. Review my latest Strategy Webinar for an in-depth breakdown of this gold technical setup and more.
Gold Price Chart - XAU/USD Daily
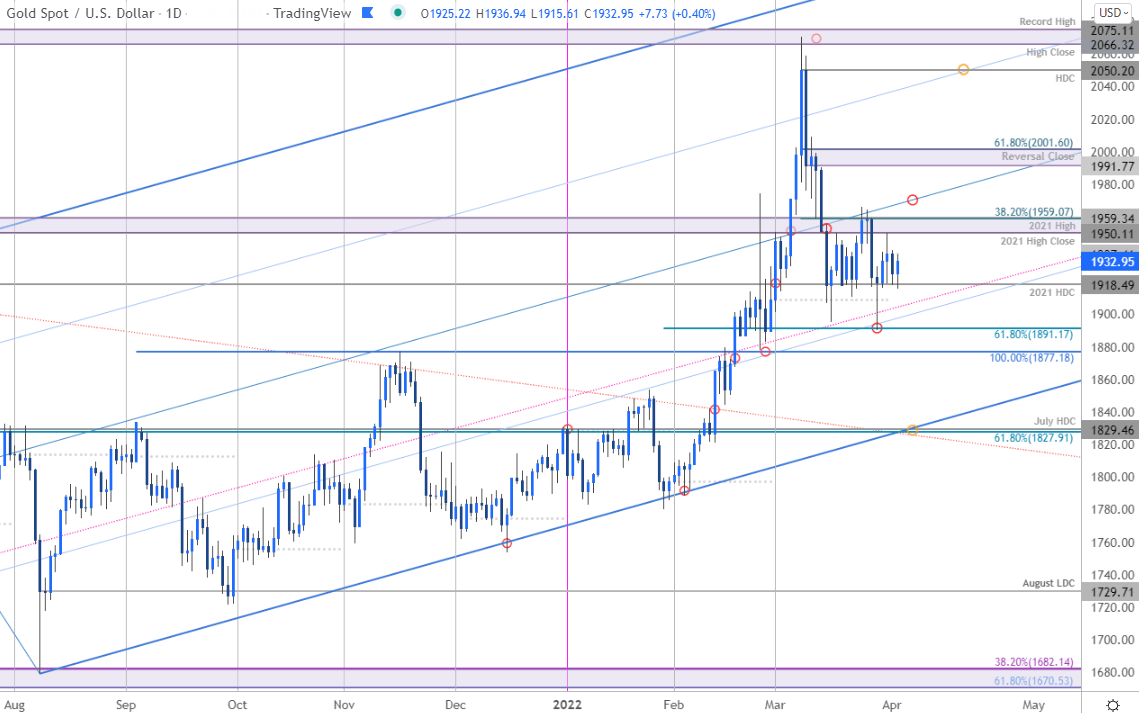
Chart Prepared by Michael Boutros, Technical Strategist; Gold on Tradingview
Technical Outlook: In last week’s Gold Price Outlook we noted, “that price has been unable to mark a daily / weekly close below the 2021 high-day close at 1918- is a near-term low in place?” The low is preserved with XAU/USD holding within the confines of a well-defined range just below confluent resistance at 1950/59- a region defined by the at 2021 high-close / 2021 high and the 38.2% Fibonacci retracement of the March decline. As gold begins to carve out the monthly opening-range we’ll looking for possible price inflection off this zone with the broader outlook constructive while above uptrend support at the 61.8% retracement of the March 2021 advance / July high-day close 1827/29. Ultimately a breach through the median-line would be needed to mount an assault on key resistance at the March 9th reversal-close / 61.8% retracement of the March range at 1991-2001.
Gold Price Chart - XAU/USD 120min
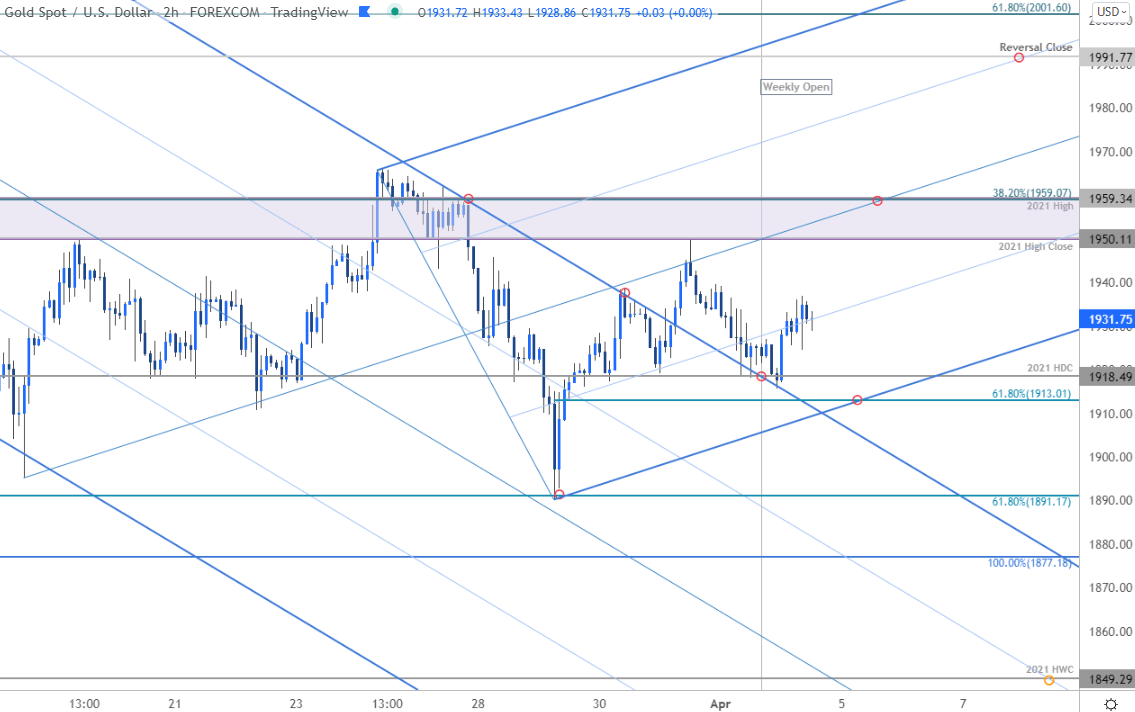
Notes: A closer look at Gold price action shows XAU/USD continuing to trade within the confines of the ascending pitchfork formation extending off the March lows. Note that the lower parallel now converges on the 61.8% retracement of the recent advance at 1913- losses should be limited to this region IF price is indeed heading higher.

Bottom line: A breakout of downtrend resistance has been tested as support and the focus is on a breakout of the weekly opening-range in the days ahead. From trading standpoint, we’re on the lookout for a possible exhaustion low while within this near-term formation with a close above 1959 needed to mark resumption. Stay nimble here into the quarterly open- weakness below this formation could see another accelerated sell-off in price. Review my latest Gold Weekly Price Outlook for a closer look at the longer-term XAU/USD technical trading levels.
For a complete breakdown of Michael’s trading strategy, review his Foundations of Technical Analysis series on Building a Trading Strategy
Gold Trader Sentiment – XAU/USD Price Chart
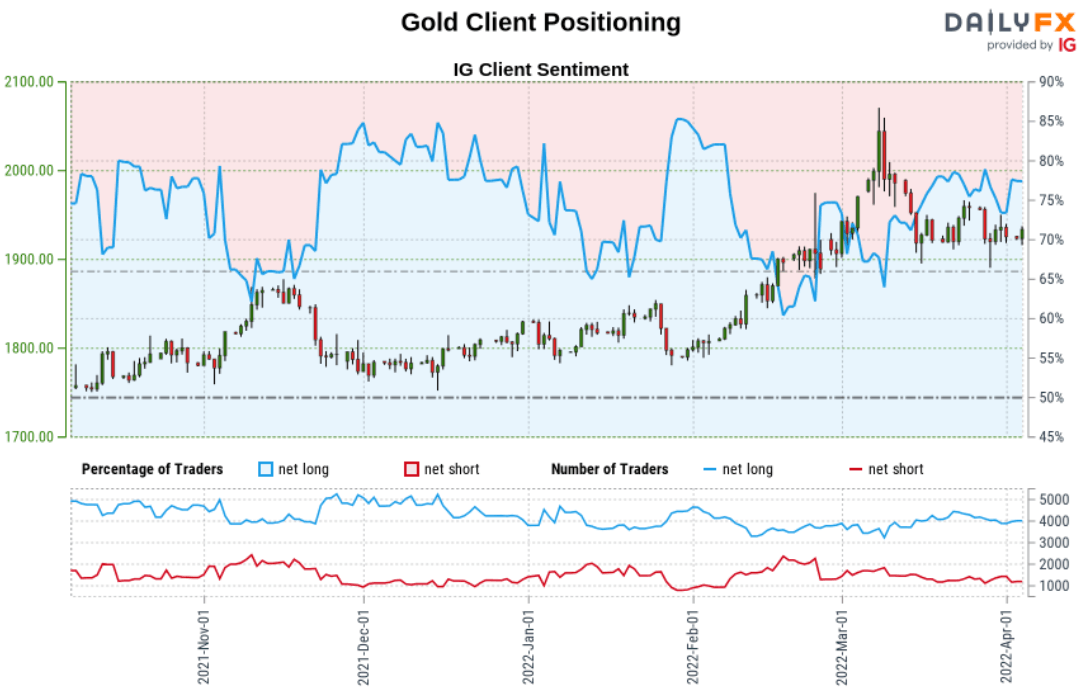
- A summary of IG Client Sentiment shows traders are net-long Gold- the ratio stands at +3.10 (75.63% of traders are long) – typically bearishreading
- Long positions are1.22% higher than yesterday and 0.34% lower from last week
- Short positions are12.29% higher than yesterday and 7.22% higher from last week
- We typically take a contrarian view to crowd sentiment, and the fact traders are net-long suggests Gold prices may continue to fall. Yet traders are less net-long than yesterday and compared with last week. Recent changes in sentiment warn that the current Gold price trend may soon reverse higher despite the fact traders remain net-long.
| Change in | Longs | Shorts | OI |
| Daily | 8% | 0% | 4% |
| Weekly | 5% | -11% | -3% |
---
Economic Calendar
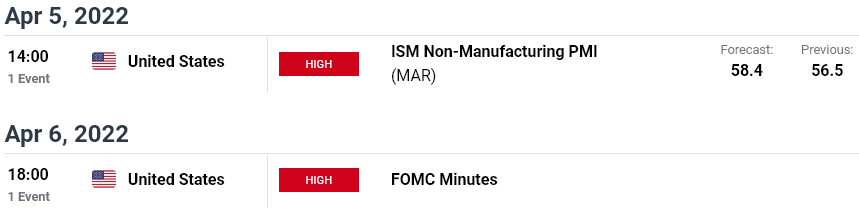
Economic Calendar - latest economic developments and upcoming event risk
Active Technical Setups
- Euro Technical Price Outlook: EUR/USD Rips Towards Trend Resistance
- British Pound Technical Outlook: GBP/USD Surges off Support- BoE Levels
- Canadian Dollar Technical Outlook: USD/CAD Slumps into Support
- Written by Michael Boutros, Technical Strategist with DailyFX
Follow Michael on Twitter @MBForex


