


Gold Technical Price Outlook: XAU/USD Near-term Trade Levels
- Gold price updated technical trade levels – Daily & Intraday Charts
- XAU/USD defends second attempt at key support- breakout potential into April open
- New to Gold Trading? Get started with this Free How to Trade Gold -Beginners Guide
Gold prices reversed sharply off key support yesterday with XAU/USD rallying more than 2.2% off the weekly / monthly lows. The recovery now takes gold towards downtrend resistance and highlights the potential for a breakout in the days ahead. These are the updated targets and invalidation levels that matter on the XAU/USD technical charts heading April open / NFP. Review my latest Strategy Webinar for an in-depth breakdown of this gold technical setup and more.
Gold Price Chart - XAU/USD Daily
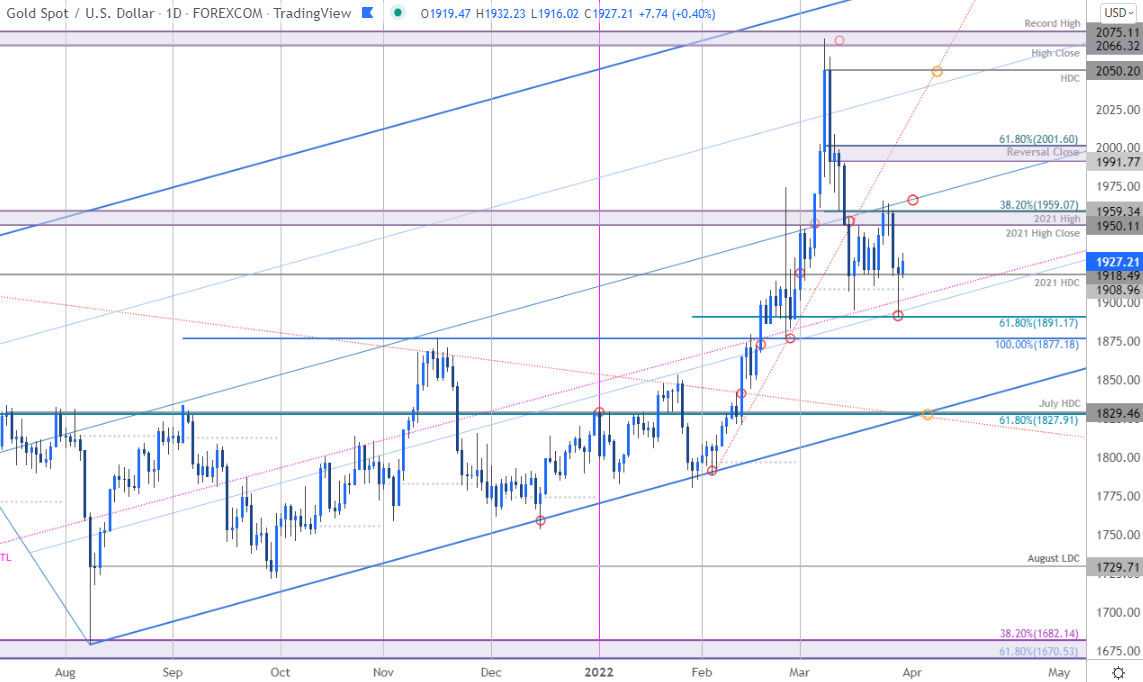
Chart Prepared by Michael Boutros, Technical Strategist; Gold on Tradingview
Technical Outlook: In my last Gold Price Outlook we noted that, “The gold washout may be nearing an end – be on the lookout for an exhaustion low.” Specifically, our focus was, “on the 61.8% retracement of the yearly-range at 1891 and 1877- both levels of interest for possible downside exhaustion IF reached.” XAU/USD registered a low at 1895 the following day before rebounding sharply with a 3.75% rally off the lows faltering last week into confluent resistance at 2021 high-close / 2021 high at 1950/59. Another wash-out into the weekly open failed at slope support yesterday with gold registering a low at 1890 before rebounding. Note that price has been unable to mark a daily / weekly close below the 2021 high-day close at 1918- is a near-term low in place?
Gold Price Chart - XAU/USD 120min
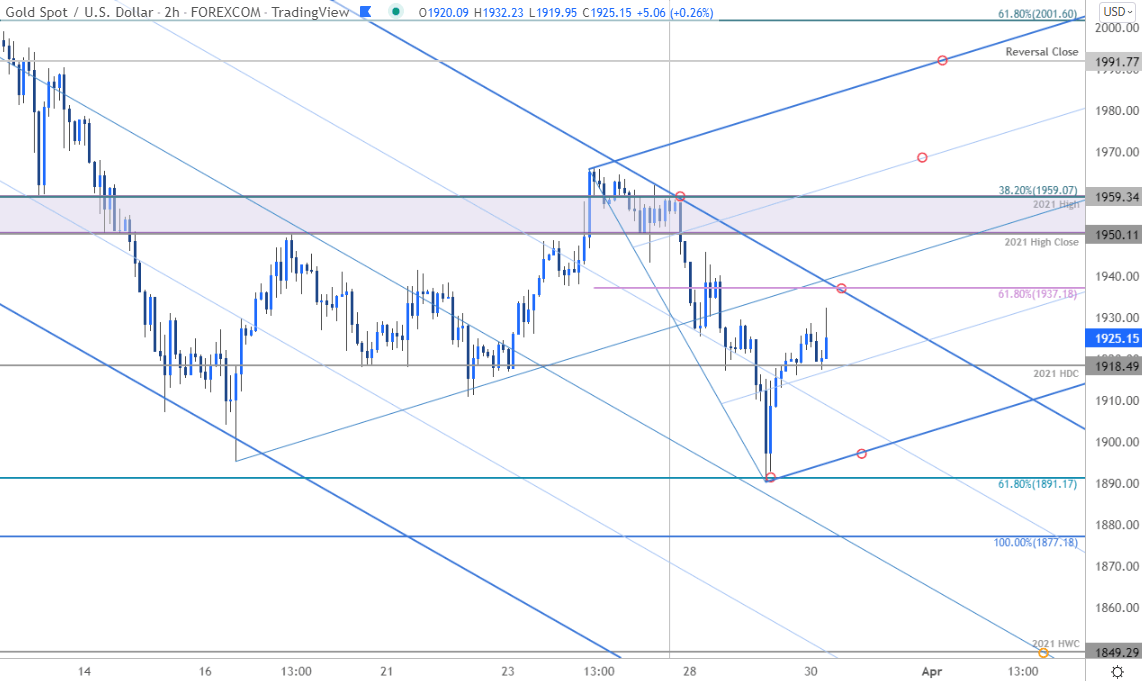
Notes: A closer look at Gold price action shows XAU/USD continuing to trade within the confines of a descending pitchfork formation extending off the monthly high. A rally just pips ahead of the median-line now looks to challenge the downtrend with initial resistance eyed at upper parallel / the 61.8% retracement of the recent decline (1937). Once again a breach / close above 1950/59 will be needed to suggest a more significant low is in place with such a scenario exposing the 75% parallel (currently ~1970) backed by the March 9th daily reversal-close at 1991 and the 61.8% Fibonacci retracement of the March range at 2001- look for a larger reaction there IF reached. Initial support now at 1918 and the objective monthly-open at 1908- losses below this threshold could fuel another bout of accelerated loses with such a scenario risking a plunge towards 1877 and longer-term uptrend support at 1827/29.

Bottom line: The gold rebound is now approaching monthly downtrend resistance – possible breakout pending. From a trading standpoint, losses should be limited by 1900 IF price is heading higher with a breach / close above 1959 needed to fuel the next leg towards critical resistance at 2000. A breakdown / close below 1891 would threaten resumption of the March downtrend and could be vicious- the battle lines are drawn heading into the April open with US Non-Farm Payrolls on tap Friday. Stay nimble here. Review my latest Gold Weekly Price Outlook for a closer look at the longer-term XAU/USD technical trading levels.
For a complete breakdown of Michael’s trading strategy, review his Foundations of Technical Analysis series on Building a Trading Strategy
Gold Trader Sentiment – XAU/USD Price Chart
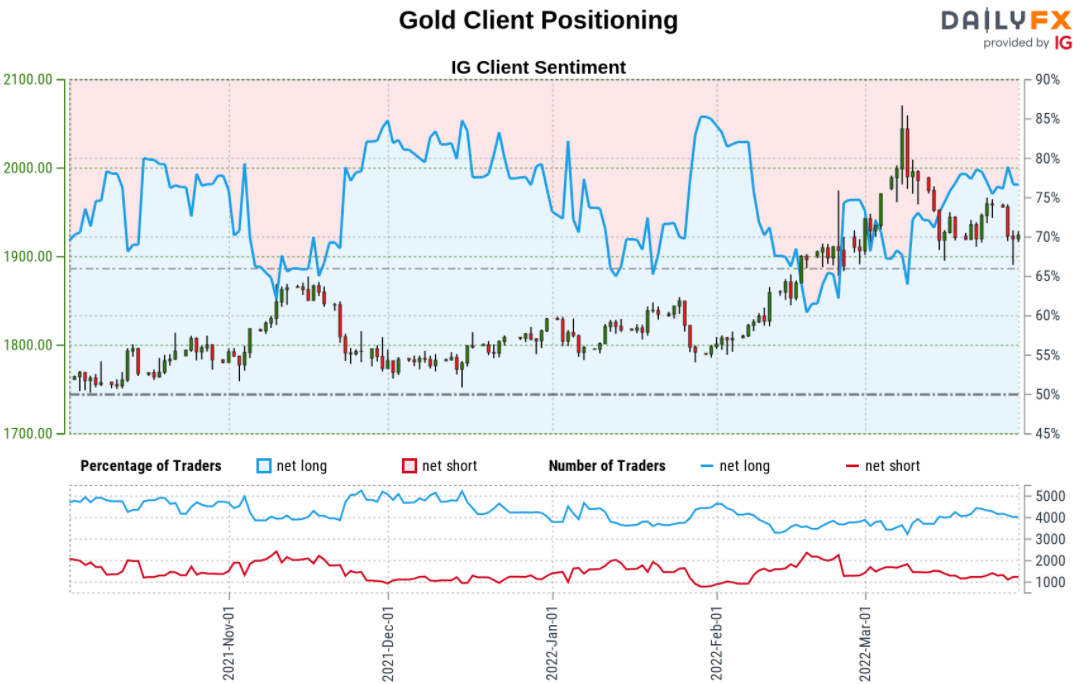
- A summary of IG Client Sentiment shows traders are net-long Gold- the ratio stands at +2.94 (74.60% of traders are long) – typically bearishreading
- Long positions are3.16% lower than yesterday and 7.57% lower from last week
- Short positions are14.60% higher than yesterday and 9.20% higher from last week
- We typically take a contrarian view to crowd sentiment, and the fact traders are net-long suggests Gold prices may continue to fall. Yet traders are less net-long than yesterday and compared with last week. Recent changes in sentiment warn that the current Gold price trend may soon reverse higher despite the fact traders remain net-long.
| Change in | Longs | Shorts | OI |
| Daily | 11% | -10% | 0% |
| Weekly | 13% | -15% | -2% |
---
Economic Calendar
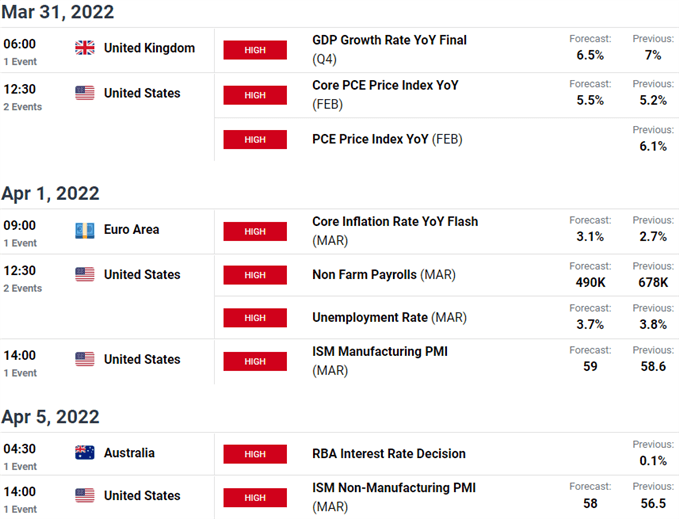
Economic Calendar - latest economic developments and upcoming event risk
Active Technical Setups
- Euro Technical Price Outlook: EUR/USD Rips Towards Trend Resistance
- British Pound Technical Outlook: GBP/USD Surges off Support- BoE Levels
- Canadian Dollar Technical Outlook: USD/CAD Slumps into Support
- Written by Michael Boutros, Technical Strategist with DailyFX
Follow Michael on Twitter @MBForex


