


Gold Price Outlook:
- Gold prices dropped below 1900 earlier in the session as higher US equities, rising US Treasury yields, and a potential ceasefire between Russia and Ukraine underscore an improving environment for risk appetite.
- The potential double top in gold prices continues to take shape, suggesting the highs for the year have been reached.
- According to the IG Client Sentiment Index, gold prices hold a mixed bias in the near-term.

More Luster Lost
More evidence is accumulating for a double top in gold prices. A ceasefire between Russia and Ukraine is potentially around the corner, leading to speculation that the sanctions levied by the European Union and the United States will soon be lifted. A prospective reduction of supply pressures in global commodity markets is sapping demand for safe haven assets, gold included.
The improvement in risk appetite is highlighted by the rise in US equity markets, but perhaps more importantly, the churn higher by real rates as US Treasury yields rise and inflation expectations pullback. As noted in mid-March, these factors are “proving to be a material headwind for further gains by gold prices here.” Otherwise, it remains the case that “what’s shaping up to be an ugly monthly candle for gold prices warns that the highs are in, and more downside is ahead.”
Gold Volatility Drops Further, Weighing on Gold Prices
Historically, gold prices have a relationship with volatility unlike other asset classes. While other asset classes like bonds and stocks don’t like increased volatility – signaling greater uncertainty around cash flows, dividends, coupon payments, etc. – gold tends to benefit during periods of higher volatility. The continued suppressionof gold volatility over the past week has continued to undercut gold prices’ ability to retain its gains from the first half of the month, and portends further losses moving forward.
GVZ (Gold Volatility) Technical Analysis: Daily Price Chart (March 2021 to March 2022) (Chart 1)

Gold volatility (as measured by the Cboe’s gold volatility ETF, GVZ, which tracks the 1-month implied volatility of gold as derived from the GLD option chain) was trading at 21.09 at the time this report was written, levels briefly seen last week and at the end of February – when Russia first invaded Ukraine. The 5-day correlation between GVZ and gold prices is +0.93 while the 20-day correlation is +0.92. One week ago, on March 22, the 5-day correlation was +0.05 and the 20-day correlation was +0.90.
Gold Price Rate Technical Analysis: Daily Chart (July 2020 to March 2022) (Chart 2)
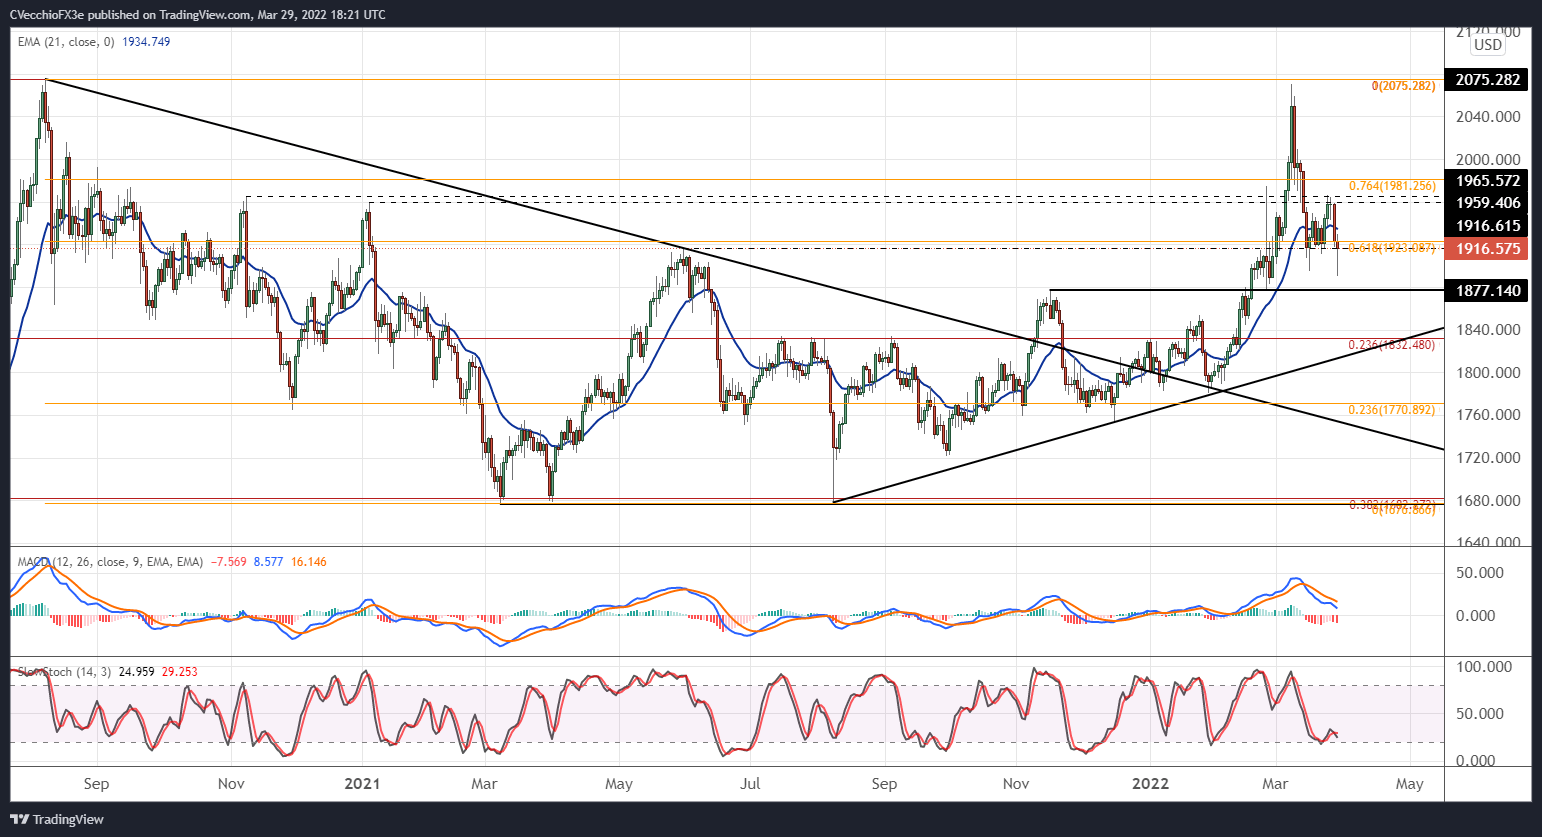
Last week it was noted that “failure to maintain the current area around 1916/1923 increases the likelihood of a return to the March low at 1895.07 in the near-term.” Gold prices set a fresh monthly low earlier today, dropping to 1890.16 before rebounding. Still below their daily 21-EMA, gold prices are beneath the entirety of the daily EMA envelope, which is in bearish sequential order. Daily MACD continues to trend lower (albeit above its signal line), while daily Slow Stochastics are moving lower back towards oversold territory. A more significant technical breakdown may be at work, as exemplified by the weekly chart below.
Gold Price Technical Analysis: Weekly Chart (October 2015 to March 2022) (Chart 3)

It remains the case that “the weekly timeframe is where the double top in gold prices becomes clear, with the apex this March and the August 2020 high constituting significant resistance.” In dropping below 1900 today, gold prices also breached former trendline support from the May 2019, March 2020, and March 2021 lows; not only did this trendline reassert itself as support, but so too did the weekly 8-EMA (two-month moving average). These first attempts at breaking support have thus far failed, but another move back to the lows may have exhausted buying supply in the market, allowing for a more considerable pullback. Gold prices are ending 1Q’22 on very shaky technical footing.

IG CLIENT SENTIMENT INDEX: GOLD PRICE FORECAST (March 29, 2022) (Chart 4)
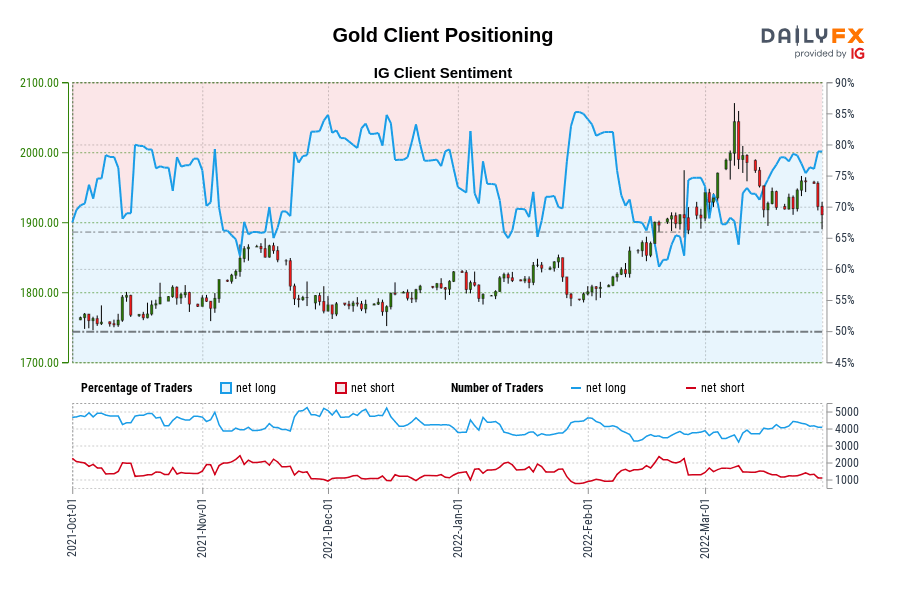
Gold: Retail trader data shows 78.10% of traders are net-long with the ratio of traders long to short at 3.57 to 1. The number of traders net-long is 1.15% lower than yesterday and 7.50% lower from last week, while the number of traders net-short is 7.47% lower than yesterday and 4.57% lower from last week.
We typically take a contrarian view to crowd sentiment, and the fact traders are net-long suggests Gold prices may continue to fall.
Positioning is more net-long than yesterday but less net-long from last week. The combination of current sentiment and recent changes gives us a further mixed Gold trading bias.
Trade Smarter - Sign up for the DailyFX Newsletter
Receive timely and compelling market commentary from the DailyFX team
--- Written by Christopher Vecchio, CFA, Senior Strategist


