


Gold Technical Price Outlook: XAU/USD Near-term Trade Levels
- Gold price updated technical trade levels – Daily & Intraday Charts
- XAU/USD plunges from key resistance around record highs- on the lookout for exhaustion low
- New to Gold Trading? Get started with this Free How to Trade Gold -Beginners Guide
Gold prices plunged more than 7.8% off last week’s highs with XAU/USD failing at a key technical zone around the record highs. The washout is underway and while the threat for further losses remains, the focus is on a possible exhaustion low in the days ahead with the FOMC interest rate decision tomorrow to offer further guidance on our near-term directional bias. These are the updated targets and invalidation levels that matter on the XAU/USD technical charts heading into the Fed. Review my latest Strategy Webinar for an in-depth breakdown of this gold technical setup and more.
Gold Price Chart - XAU/USD Daily

Chart Prepared by Michael Boutros, Technical Strategist; Gold on Tradingview
Technical Outlook: In my last Gold Prices Outlook we noted that the XAU/USD was testing, “a key resistance zone at the 2021 high-close / 2021 high at 1950/59 before pulling back- the focus remains on a reaction off this mark with a breach / daily close above needed to fuel the next leg higher.” Gold ripped through four-days later with the breakout stretching into critical resistance at the record high-close / record high at 2066/75 before reversing sharply lower- that decline has now pivoted back below the 1950/59 zone. Is a high in place or is this just near-term exhaustion?
Gold Price Chart - XAU/USD 120min
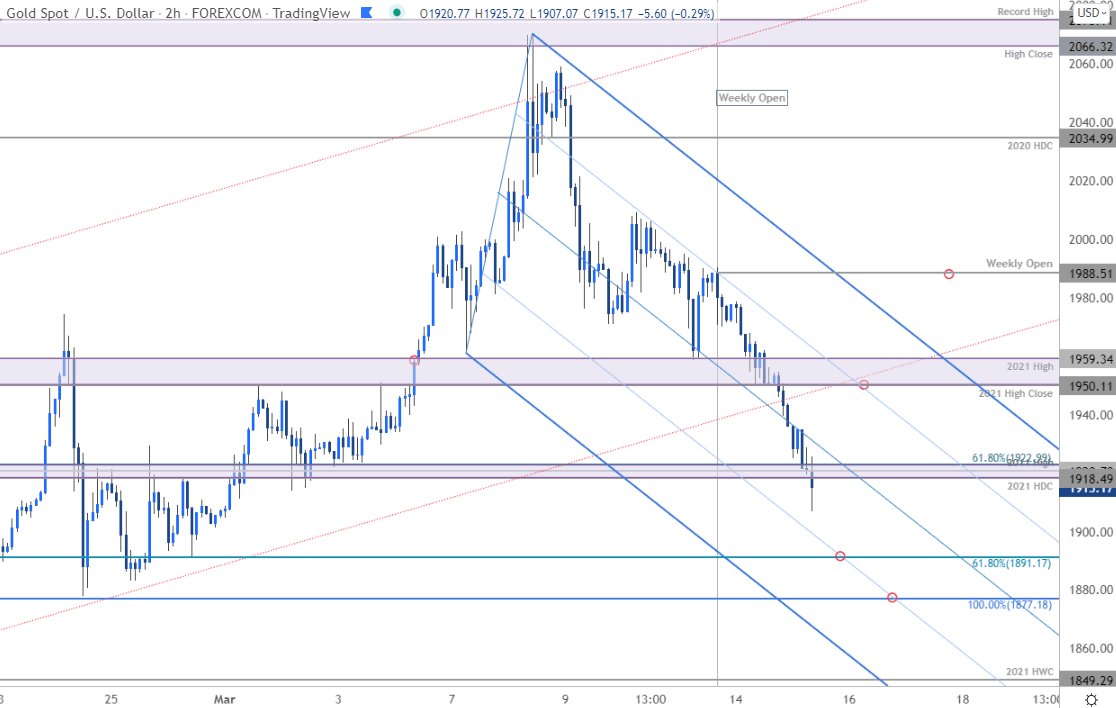
Notes: A closer look at Gold price action shows XAU/USD breaking below channel support early in the week with the sell-off now attempting to break below near-term support at the 2021 high-day close / 61.8% Fibonacci retracement at 1918/23- watch the close. This near-term formation may be in play but its too soon to rely on- for now, look for resistance back at 1950/59 with a breach / daily close above the objective weekly open at 1988 needed to suggest a more significant low is in place. A break lower from here would keep the focus on the 61.8% retracement of the yearly-range at 1891 and 1877- both levels of interest for possible downside exhaustion IF reached. Ultimately a break / daily close below 1827/29 would be needed to invalidate the broader uptrend in gold.

Bottom line: The gold washout may be nearing an end – be on the lookout for an exhaustion low. From a trading standpoint, a good zone to reduce short-exposer / lower protective stops- rallies should be limited by the upper parallel IF price is heading lower. Ultimately, a larger washout here may offer more favorable opportunities closer to uptrend support. Stay nimble heading into the FOMC tomorrow – expect volatility as markets reprice the Fed’s updated economic projections as they pertain to growth, employment an (most importantly) inflation. Review my latest Gold Weekly Price Outlook for a closer look at the longer-term XAU/USD technical trading levels.
For a complete breakdown of Michael’s trading strategy, review his Foundations of Technical Analysis series on Building a Trading Strategy
Gold Trader Sentiment – XAU/USD Price Chart
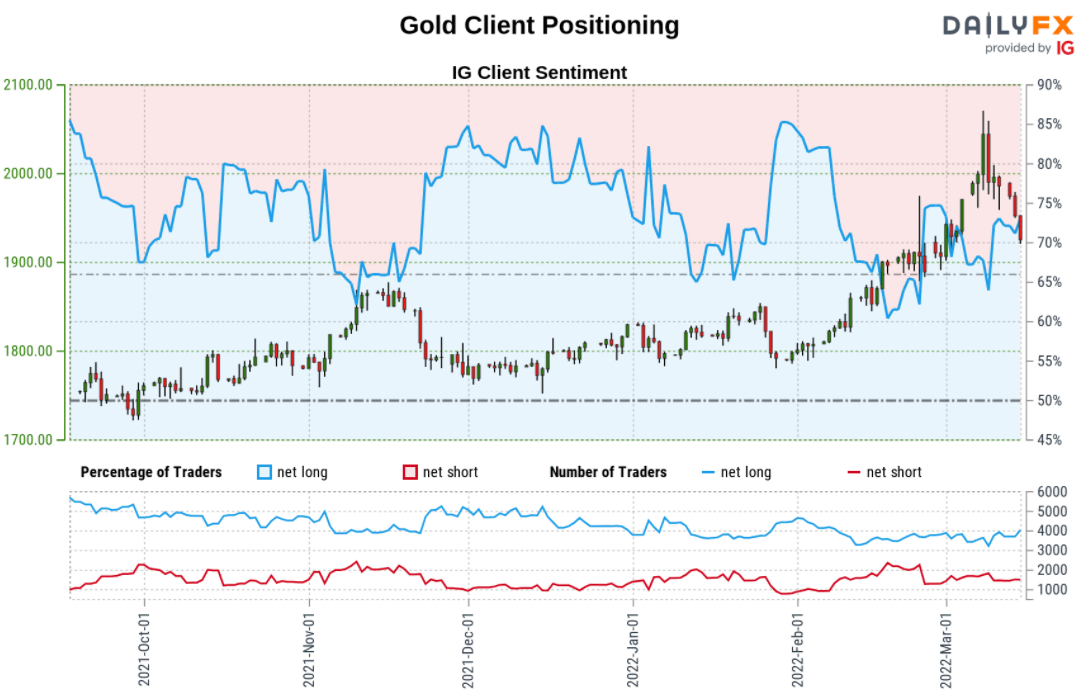
- A summary of IG Client Sentiment shows traders are net-long Gold- the ratio stands at +2.45 (72.15% of traders are long) – typically bearishreading
- Long positions are6.49% lower than yesterday and 0.78% lower from last week
- Short positions are4.37% lower than yesterday and 10.82% lower from last week
- We typically take a contrarian view to crowd sentiment, and the fact traders are net-long suggests Gold prices may continue to fall. Traders are less net-long than yesterday but more net-long from last week. The combination of current positioning and recent changes gives us a further mixed Gold trading bias from a sentiment standpoint.
| Change in | Longs | Shorts | OI |
| Daily | -2% | -2% | -2% |
| Weekly | 3% | 16% | 10% |
---
Active Technical Setups
- Euro Technical Price Outlook: EUR/USD Bears Pounce Post-ECB
- Canadian Dollar Technical Outlook: USD/CAD Slumps into Support
- S&P 500, Nasdaq Outlook: Stocks at Risk as Rally Hits Resistance
- US Dollar Technical Outlook: USD Rips as War Erupts in Europe
- Australian Dollar Technical Outlook: Aussie Bulls Eye Key Resistance
- Written by Michael Boutros, Technical Strategist with DailyFX
Follow Michael on Twitter @MBForex


