


Gold Price Outlook:
- Gold prices have rebounded from rising channel support – as well as the descending trendline from the all-time high.
- A spat of weaker US economic data has dragged down the US Dollar, giving gold prices a short-term boost. However, falling gold volatility is a concern.
- According to the IG Client Sentiment Index, gold prices have a bearish bias in the near-term.

US Jobs Data in Focus
Gold prices are working on their third consecutive day higher as a spat of weaker US economic data has undercut US Treasury yields, and in turn, the US Dollar (via the DXY Index). Markets are quickly shifting into a ‘bad news is good news’ mindset, insofar as weaker US data means that Federal Reserve policymakers may not be as aggressive with their tone in forthcoming remarks.
Outside of the weaker US Dollar and a potential contraction in the US nonfarm payrolls report this Friday, there are reasons to doubt that gold price’s push higher will be sustained. Gold volatility has been dropping quickly in recent days, which historically tends to correlate with lower gold prices. Moreover, the seasonal tendency for February suggests weaker gold prices over the course of the month.
Gold Volatility and Gold Prices’ Relationship Inverts
Historically, gold prices have a relationship with volatility unlike other asset classes. While other asset classes like bonds and stocks don’t like increased volatility – signaling greater uncertainty around cash flows, dividends, coupon payments, etc. – gold tends to benefit during periods of higher volatility. The recent slump in gold volatility suggests any gains by gold prices may be limited.
GVZ (Gold Volatility) Technical Analysis: Daily Price Chart (February 2021 to February 2022) (Chart 1)

Gold volatility (as measured by the Cboe’s gold volatility ETF, GVZ, which tracks the 1-month implied volatility of gold as derived from the GLD option chain) was trading at 15.79 at the time this report was written. The relationship between gold prices and gold volatility has dramatically reverted in recent days. The 5-day correlation between GVZ and gold prices is -0.96 while the 20-day correlation is -0.26. One week ago, on January 26, the 5-day correlation was +0.24 and the 20-day correlation was +0.33.
Gold Price Rate Technical Analysis: Daily Chart (February 2021 to February 2022) (Chart 2)

Gold prices weren’t able to reach the 1860/1870 level eyed in the prior update, instead turning sharply lower around the January Fed meeting. But the pullback saw gold prices return to a cluster of support just above 1780, the descending trendline from the August 2020 and June 2021 swing highs as well as rising channel support from the August 2021 and December 2021 swing lows. If gold prices continue to rally over the coming days around the January US NFP report, it may present a ‘sell the rally’ opportunity amidst a backdrop of still-rising US real yields, which present a significant headwind for gold prices in 2022.
Gold Price Technical Analysis: Weekly Chart (October 2015 to February 2022) (Chart 3)
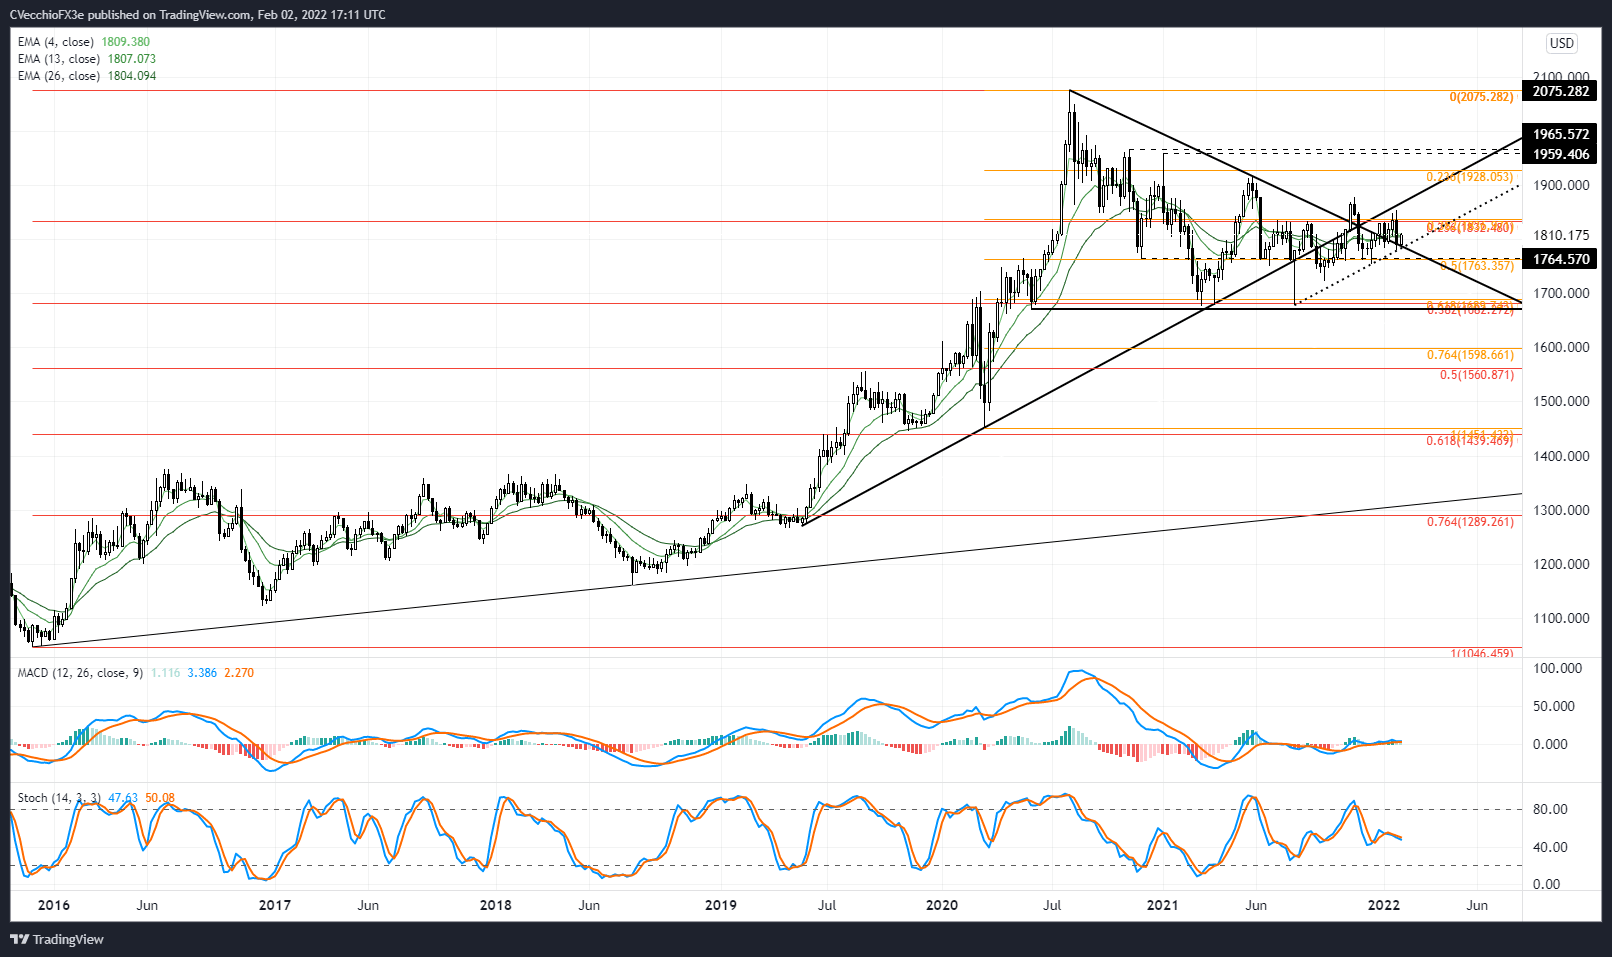
Gold prices are holding below their weekly 4-, 13-, and 26-EMA envelope, which otherwise retains its positive slop. Weekly MACD is flat at its signal line, while weekly Slow Stochastics are trending lower albeit still above their median line. If anything, the weekly timeframe for gold prices suggests that more choppy, sideways trading is ahead for the foreseeable future.

IG CLIENT SENTIMENT INDEX: GOLD PRICE FORECAST (February 2, 2022) (Chart 4)

Gold: Retail trader data shows 82.61% of traders are net-long with the ratio of traders long to short at 4.75 to 1. The number of traders net-long is 1.44% higher than yesterday and 21.83% higher from last week, while the number of traders net-short is 0.81% lower than yesterday and 32.18% lower from last week.
We typically take a contrarian view to crowd sentiment, and the fact traders are net-long suggests Gold prices may continue to fall.
Traders are further net-long than yesterday and last week, and the combination of current sentiment and recent changes gives us a stronger Gold-bearish contrarian trading bias.
--- Written by Christopher Vecchio, CFA, Senior Strategist


