


Gold Price Outlook:
- Gold prices have rallied sharply, seemingly disconnecting from US yields and the US Dollar.
- However, with gold volatility, equity volatility, and Treasury volatility surging over the past 24-hours, investors may be flocking to gold as a safe haven.
- According to the IG Client Sentiment Index, gold prices have a mixed bias in the near-term.

Options Expiry in Play
Gold prices are on the move this morning, surging to fresh monthly and yearly highs. While US Treasury yields have backed down and the US Dollar (via the DXY Index) has pulled back, the moves are minor relative to the sharp uptick in gold prices. But there may be a reason for this disconnect: today is the options expiry day for volatility contracts.
Several measures of volatility remain in contango, which means front-month contracts are trading at lower prices than contracts expiring further out in time. As traders roll their volatility exposure forward, they are forced to buy higher priced contracts. Accordingly, measures of US equity volatility and bond volatility – VIX and MOVE, respectively – are trading higher on the day. This has spilled over into precious metals, where measures of volatility have spiked as well.
Gold Volatility and Gold Prices’ Relationship Normalizing
Historically, gold prices have a relationship with volatility unlike other asset classes. While other asset classes like bonds and stocks don’t like increased volatility – signaling greater uncertainty around cash flows, dividends, coupon payments, etc. – gold tends to benefit during periods of higher volatility. Regardless of the reason for higher volatility – the options expiry or perhaps greater concern around geopolitical tensions in Eastern Europe – gold prices are benefiting.
GVZ (Gold Volatility) Technical Analysis: Daily Price Chart (January 2021 to January 2022) (Chart 1)
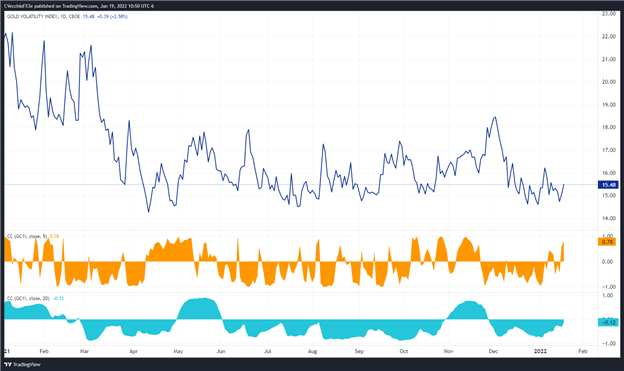
Gold volatility (as measured by the Cboe’s gold volatility ETF, GVZ, which tracks the 1-month implied volatility of gold as derived from the GLD option chain) was trading at 15.48 at the time this report was written. The relationship between gold prices and gold volatility has been rapidly normalizing in recent days. The 5-day correlation between GVZ and gold prices is +0.78 while the 20-day correlation is -0.12. One week ago, on January 12, the 5-day correlation was -0.49 and the 20-day correlation was -0.28.
Gold Price Rate Technical Analysis: Daily Chart (January 2021 to January 2022) (Chart 2)
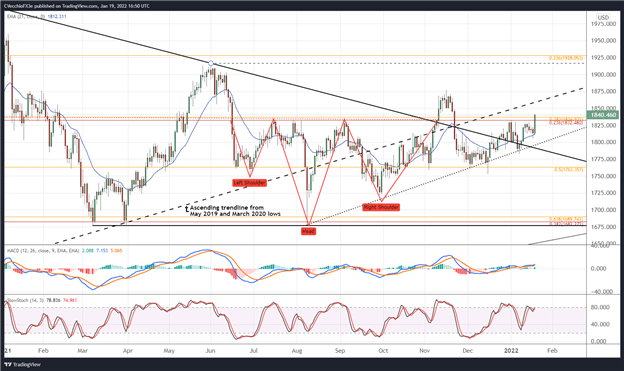
Last week it was noted that “the technical structure points to slowly-but-surely budding technical momentum that could ultimately prevail…a rally into 1835 would likely present a significant selling opportunity, especially as the DXY Index nears a multi-year zone of support/resistance that could stem its sell-off.”
However, with the 1835 hurdle cleared, traders may want to look higher before exploring new selling opportunities. The next cluster of resistance lies around 1860/1870, where the ascending trendline from the May 2019, March 2020, and March 2021 lows comes into play.
Gold Price Technical Analysis: Weekly Chart (October 2015 to January 2022) (Chart 3)
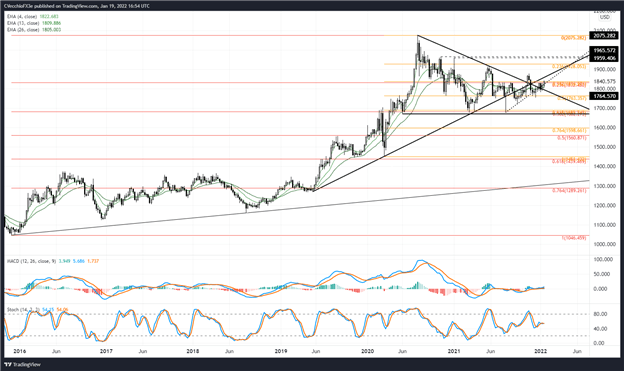
Nothing changes on a longer-term perspective: “It’s worth reminding that January is the best month of the year for gold prices according to seasonality studies, so there is a quantitative tailwind helping provide support in the near-term. It also remains the case that the weekly 4-, 8-, and 13-EMA envelope is taking on a positive slope. Alongside weekly MACD turning higher through its signal line, and weekly Slow Stochastics advancing above their median line, bullish momentum has increased in recent weeks, opening the possibility for more gains henceforth before fundamental headwinds curtail the rally.”

IG CLIENT SENTIMENT INDEX: GOLD PRICE FORECAST (January 19, 2022) (Chart 4)
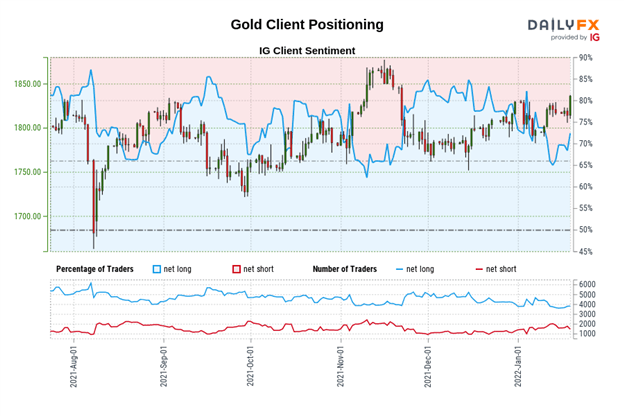
Gold: Retail trader data shows 68.37% of traders are net-long with the ratio of traders long to short at 2.16 to 1. The number of traders net-long is 0.64% higher than yesterday and 3.22% lower from last week, while the number of traders net-short is 14.62% higher than yesterday and 8.66% lower from last week.
We typically take a contrarian view to crowd sentiment, and the fact traders are net-long suggests Gold prices may continue to fall.
Positioning is less net-long than yesterday but more net-long from last week. The combination of current sentiment and recent changes gives us a further mixed Gold trading bias.
--- Written by Christopher Vecchio, CFA, Senior Strategist


