


Gold/Silver Technical Outlook:

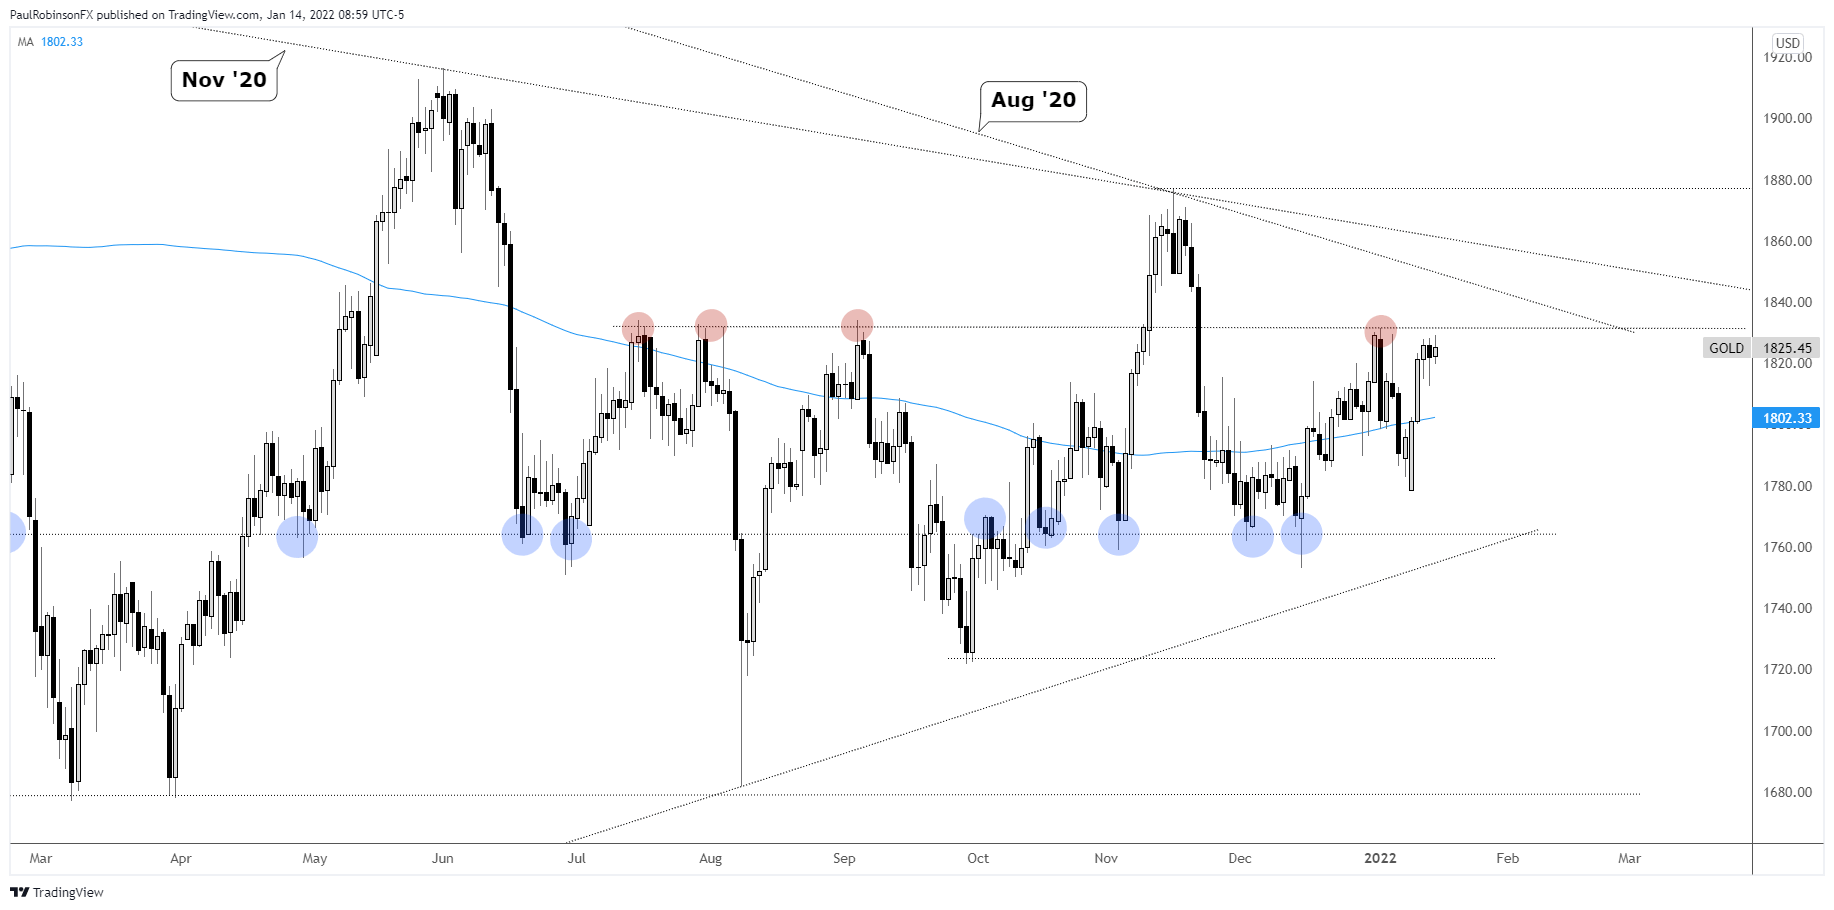
Gold had a spirited move higher this week, but is now finding itself at an important area of resistance. Since July gold has run into the 1830 area on four occasions, with the most recent run-in coming to end last year and begin this one.
It’s a big level that if gold is unable to overcome will likely result in more range activity in the days/weeks ahead. Gold has been a difficult handle the past half-year or so and could continue to be-so for a bit longer. At some point that will change, but not until we get some freedom of movement from levels that are becoming all too familiar.
A strong break above the 1830s won’t ensure this is happening but will be an important first step towards seeing to it that gold finally gets out into open space. There is a trend-line from August and then November of 2020 that will quickly come into play on a breakout, so price action will need to be monitored upon approach.
Overall, conviction right now is low in either direction. If we see gold pierce the aforementioned 1830s resistance and reverse back below, this may lead to a near-term short opportunity. A breakout above resistance gives longs the upper hand, but will tread cautiously until we see a move actually hold up and not reverse.

Gold Daily Chart
Silver doesn’t have the same substantial ceiling that gold has, but if gold turns down from resistance then weakness in silver is likely to develop in some form. The level on the top-side to watch is 23.43, followed by the trend-line from May that is currently close to 24.
A turn lower from here may bring into play a trend-line off the December low that is slowly becoming part of a channel structure off that low. For now, conviction is low and it is preferred to pay closer attention to the more substantial level in gold around 1830.
Silver Daily Chart

Resources for Forex Traders
Whether you are a new or experienced trader, we have several resources available to help you; indicator for tracking trader sentiment, quarterly trading forecasts, analytical and educational webinars held daily, trading guides to help you improve trading performance, and one specifically for those who are new to forex.
---Written by Paul Robinson, Market Analyst
You can follow Paul on Twitter at @PaulRobinsonFX


