


Gold Price Forecast:
- Gold put in another reaction at the confluent resistance zone between 1829-1832.
- The recent bearish move also entailed a bearish break of a rising wedge pattern. The big question now is one of continuation, and given current juxtaposition of rates markets, that bar is high. NFP is tomorrow and this is a focal point for the Fed and monetary policy.
- The analysis contained in article relies on price action and chart formations. To learn more about price action or chart patterns, check out our DailyFX Education section.

Gold prices are showing a fairly bearish scenario on short-term charts at the moment, following the earlier-week re-test of resistance at the 1830 area.
There’s a confluent resistance zone with Fibonacci levels at 1829 and 1832 that held the highs in Gold as the page turned into 2022; and after a reaction there on Monday, price action quickly jumped back for another test yesterday. But, just as we’d see in the prior iteration bears responded and that move continues to price in as Gold is now trading at a fresh two-week-low.
Along the way, prices took out support in a rising wedge formation, which will often be approached with the aim of bearish reversal such as we’re seeing now. The big question at this point is one of continuation potential, and the deck may be stacked against that scenario at the moment, while I’ll explore in more depth after the following chart.
Gold Four-Hour Price Chart: Rising Wedge Filling In
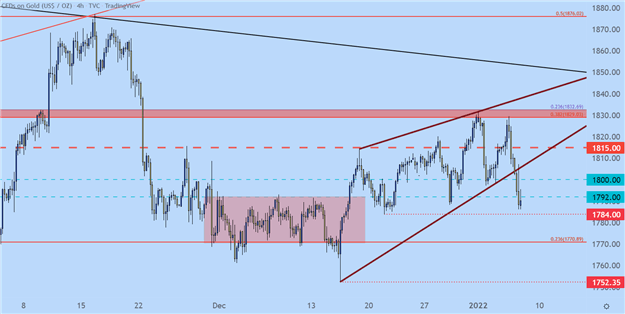
Chart prepared by James Stanley; Gold on Tradingview
Gold Drivers, Factors of Vulnerability, NFP
The big push point on Gold of recent is rates. If you connect the August, 2020 top to the yield on the 10 year note, you’ll see how Gold started to get hit as rates started to run-higher, and as that theme continued through last year Gold prices very much remained on their back foot.
And with the Fed signaling a turn in policy at September and December FOMC rate decisions, that theme only heated up and that’s kept Gold prices in a very defensive posture.
But, at this point, rates markets are fairly juiced with a 49% expectation for at least four rate hikes out of the Fed this year; and there’s even a 70% chance (as of this writing) for a hike at the March rate decision.
This seems aggressive for a bank that’s displayed a very dovish posture over the past couple of years and, to a similar degree, the past decade-plus.
As a matter of fact, if we draw back to the December rate decision, the reason that stocks and risk assets didn’t absolutely tank as the Fed forecasted 2-3 hikes in 2022 was the press conference, in which Powell took on a very dovish tone, saying that the bank wasn’t going to hike rates until they were convinced on ‘full employment.’ What might that be, that’s a great question as the NFP report in early-December showed a 4.2% unemployment rate.
But, that comment was enough to keep risk running into the end of the year and through the 2022 open. The next chapter of this story drops tomorrow with Non-farm Payrolls for the month of December. And ADP earlier this week showed a massive beat which can feed into the expectation for tomorrow, with markets looking for a 400k headline number to go along with a 4.1% unemployment rate.
Beats and strong reads at tomorrow’s NFP report could stoke those rate hike expectations a bit. How much remains a big question because it really appears that rates markets are priced for a best case scenario already. If tomorrow’s number disappoints, however, there could be a retreat in rates along with hike expectations around the Fed for 2022, and this could lead to a quick pop higher in Gold prices.
Gold Techs, Longer-Term
Taking a step back on the chart and there remains big picture bearish potential. Timing, however, remains an issue as the descending triangle formation that’s brewing on the weekly chart can take some time to fill-in.
The lines-in-the-sand on that formation, however, are fairly clear, with the support zone around 1680 as the key spot of emphasis. Near-term, there’s short-term support potential around 1771 and 1734 before that longer-term zone comes into play.
Coalescing rate expectations with this longer-term chart, and likely we’ll need to see continued ramp in inflation in the first-half of this year to force the Fed into at least three hikes this year, with hastening in 2h, 22 for this formation to fill-in quickly. Otherwise, Gold prices could range for a while until that support begins to get tested. But, likely whatever brings that on will be a fast and violent move, and given how vulnerable Gold prices have been for the past year, that scenario could rear its ugly head without much notice or forewarning.
Gold Weekly Price Chart

Chart prepared by James Stanley; Gold on Tradingview
--- Written by James Stanley, Senior Strategist for DailyFX.com
Contact and follow James on Twitter: @JStanleyFX


