


Gold Price Outlook:
- The narrative around gold prices may be shifting as delta variant concerns infect global financial markets.
- But gold prices are still in ‘the technical woods’ yet, having failed to achieve 1835.
- According to the IG Client Sentiment Index, gold prices have a bullish bias in the near-term.

Chopping that Wood
Two weeks ago, it was noted that “gold prices find themselves attempting to ‘turn the corner,’ technically speaking. Technical gauges of momentum have indeed started to turn higher, but questions remain. As the saying goes, ‘more wood needs to be chopped’ before gold prices exit ‘the technical woods.’”
Since then, gold prices have been chopping that wood, sitting along the brush line now, with the clearing in sight. Alas, questions remain. The rally seen in July failed to clear the technical threshold of 1835, which was previously noted as the point with which we could say with a degree of certitude that gold prices had exited ‘the technical woods.’
Now that financial markets are taking on a risk-off tone thanks to delta variant concerns – akin to last summer, when fears of a second wave helped spur gold prices to a new all-time high – it appears that gold prices have a strengthened fundamental tailwind.
Gold Volatility and Gold Prices Out of Sync
Historically, gold prices have a relationship with volatility unlike other asset classes. While other asset classes like bonds and stocks don’t like increased volatility – signaling greater uncertainty around cash flows, dividends, coupon payments, etc. – gold tends to benefit during periods of higher volatility. Like last summer, high volatility is beginning to emerge as COVID infection concerns proliferate.
GVZ (Gold Volatility) Technical Analysis: Daily Price Chart (July 2020 to July 2021) (Chart 1)
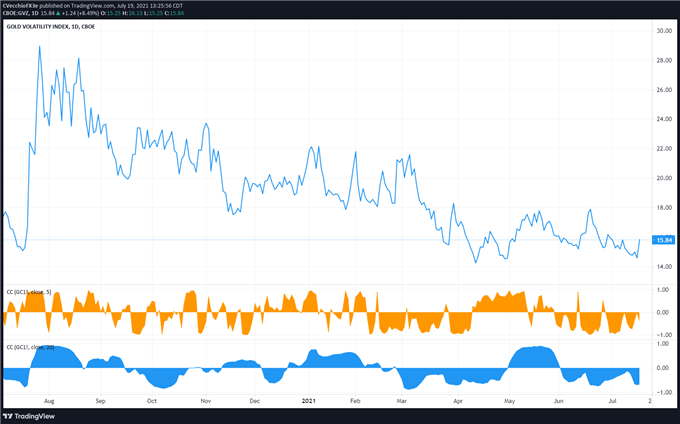
Gold volatility (as measured by the Cboe’s gold volatility ETF, GVZ, which tracks the 1-month implied volatility of gold as derived from the GLD option chain) was trading at 15.84. The relationship between gold prices and gold volatility remains out of sync on a longer time horizon, but signs have emerged that the relationship is normalizing. The 5-day correlation between GVZ and gold prices is -0.40 while the 20-day correlation is -0.67. One week ago, on July 12, the 5-day correlation was -0.49 and the 20-day correlation was -0.12.
Gold Price Rate Technical Analysis: Daily Chart (July 2020 to July 2021) (Chart 2)
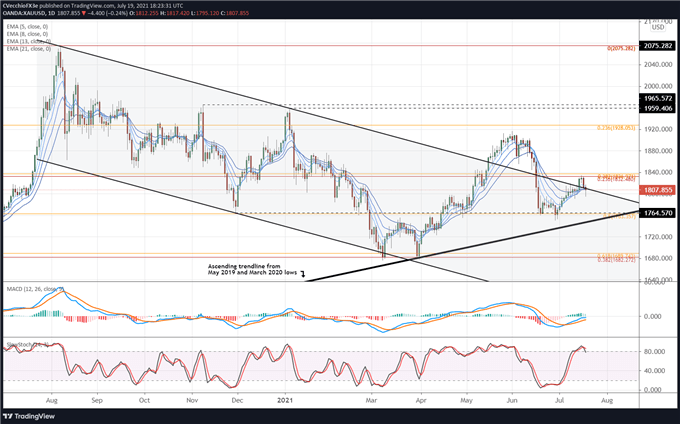
Gold prices have struggled to overcome the descending channel measured against the August 2020 and January 2021 swing highs, rebuffed by the cluster of Fibonacci levels in the low-1830s. It was previously noted that “it would appear that gold prices aren’t out of ‘the technical woods’ until 1835 is achieved,” and the high reached last week came in at 1834.20 – not yet achieving our bullish confidence threshold. Today’s daily hammer candle at the confluence of bull flag resistance (now support) and the daily EMA envelope suggest that momentum has turned higher in the short-term; price action over the past few days is merely a back-and-fill.
Gold Price Technical Analysis: Weekly Chart (October 2015 to July 2021) (Chart 3)
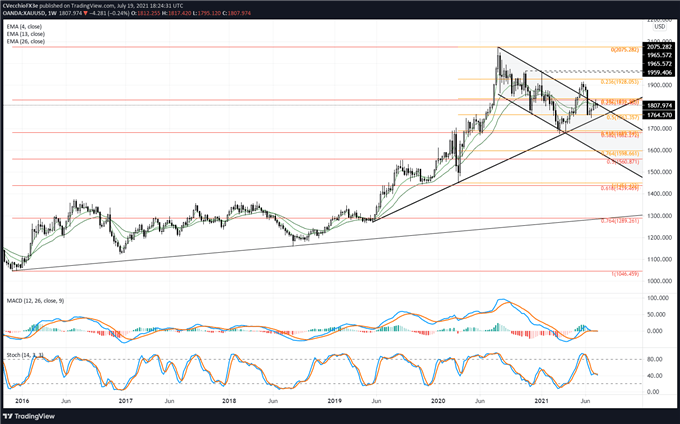
As noted in mid-June, “it is now no longer applicable to apply a longer-term bullish view on gold prices; the outlook is decidedly neutral at present time. The threat of a more significant breakdown looms, and without more progression back above the descending trendline from the August 2020 and January 2021 highs, then it stands to reason that the technical structure is unfavorable.” We may be nearing the point at which it is once more appropriate to take a longer-term bullish perspective.

GOLD PRICE FORECAST (July 19, 2021) (CHART 4)
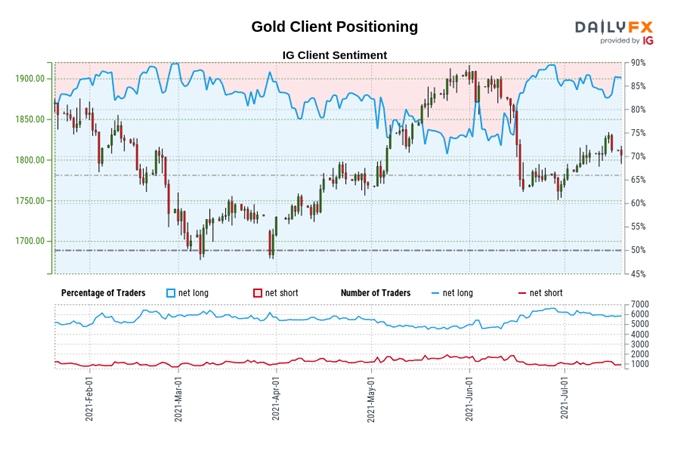
Gold: Retail trader data shows 84.78% of traders are net-long with the ratio of traders long to short at 5.57 to 1. The number of traders net-long is 7.25% lower than yesterday and 10.43% lower from last week, while the number of traders net-short is 10.14% higher than yesterday and 7.12% lower from last week. We typically take a contrarian view to crowd sentiment, and the fact traders are net-long suggests Gold prices may continue to fall.
Yet traders are less net-long than yesterday and compared with last week. Recent changes in sentiment warn that the current Gold price trend may soon reverse higher despite the fact traders remain net-long.
--- Written by Christopher Vecchio, CFA, Senior Currency Strategist


