


Gold Price Outlook:
- Are gold prices the ‘canary in the coal mine’ for the Federal Reserve meeting? Taper talk may indeed be on the menu (even if it won’t formally arrive until later this year).
- A sharp downdraft in some commodity prices has constrained inflation expectations, allowing US real yields to edge higher and thus take some of the shine off of gold prices.
- According to the IG Client Sentiment Index, gold prices have a mixed bias in the near-term.
Canary in the Coal Mine
Gold prices have proved highly sensitive to shifts in US interest rates in recent months, which is why price action today is so intriguing. Despite the fact that US Treasury yields sold off into last week and have yet to stage a meaningful recovery, gold prices dropped by nearly -1.5% before rebounding (last spotted down -0.74%). Case and point: earlier, gold prices dropped below the lows around both the May US inflation report and the May US nonfarm payrolls report.
In part, gold’s weakness may be attributed to a sharp downdraft in some commodity prices which has in turn constrained inflation expectations, allowing US real yields to edge higher and thus take some of the shine off of gold prices. Another perspective may be that, because of the rallies taking place among cryptocurrencies, ‘old fashioned gold’ is falling out of favor for the ‘new digital gold.’
But the more interesting possibility: gold is the ‘canary in the coal mine’ for the June Federal Reserve policy meeting this Wednesday.
Gold prices have been a beneficiary of the combination of loose fiscal and monetary policy. But if the FOMC signals that taper talk is on the menu (ultimately with a formal announcement regarding a desire to taper in September, followed by technical details in December, and then the start of actual tapering in January 2022), gold prices will lose a potential catalyst that has gilded the path higher over the past year.

Gold Volatility, Gold Prices Decoupling
Historically, gold prices have a relationship with volatility unlike other asset classes. While other asset classes like bonds and stocks don’t like increased volatility – signaling greater uncertainty around cash flows, dividends, coupon payments, etc. – gold tends to benefit during periods of higher volatility.
GVZ (Gold Volatility) Technical Analysis: Daily Price Chart (June 2020 to June 2021) (Chart 1)
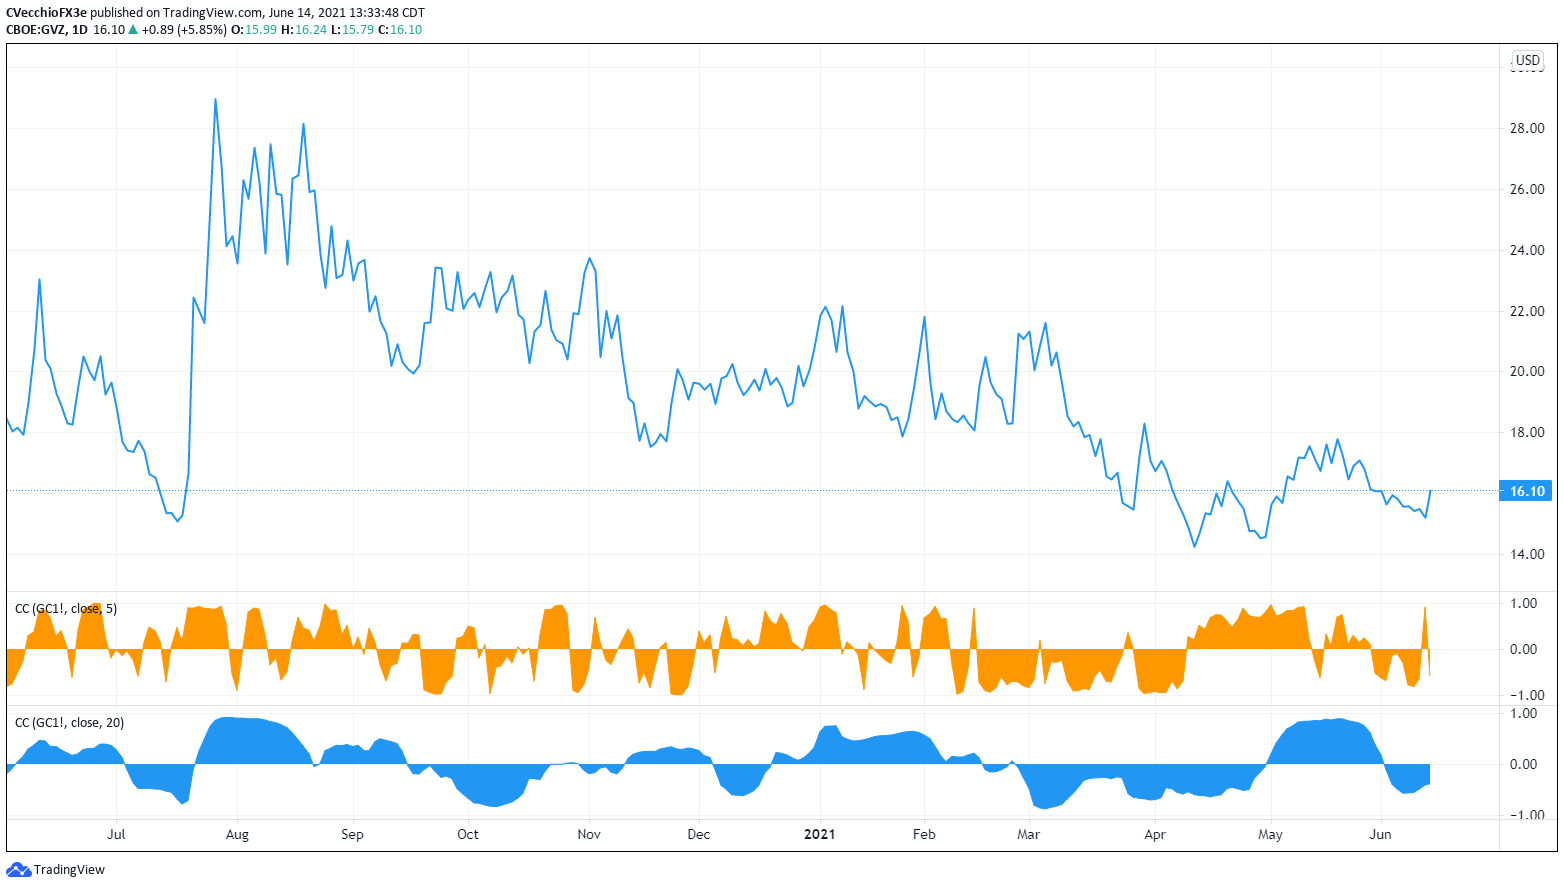
Gold volatility (as measured by the Cboe’s gold volatility ETF, GVZ, which tracks the 1-month implied volatility of gold as derived from the GLD option chain) is trading at 16.10, what would be the highest closing level for June. Concerningly, despite expanding gold volatility (typically a bullish development for gold prices), spot bullion is falling. The 5-day correlation between GVZ and gold prices is -0.58 while the 20-day correlation is -0.40. One week ago, on June 7, the 5-day correlation was -0.30 and the 20-day correlation was -0.58.
Gold Price Rate Technical Analysis: Daily Chart (March 2020 to June 2021) (Chart 2)

In the prior gold price forecast, it was noted that “considering that this uptrend constitutes the move that saw long-term bull flag resistance break in early-May, it may be considered that the pullback at the start of June was the breakout retest. It would also be the case that this means the path of least resistance is once more higher for gold prices.” While initially correct, current price action has negated this point of view.
In fact, by losing the uptrend from the March and April swing lows, gold price’s near- and longer-term bullish postures may be imperiled. Bearish momentum has started to accelerate, with gold prices fully below their daily EMA envelope (which is not yet in bearish sequential lower). Daily MACD’s contraction in bullish territory has accelerated, and daily Slow Stochastics have quickly fallen towards oversold territory.
If gold prices are the canary in the coal mine for the Federal Reserve meeting this Wednesday, it may be the case that the purported taper timeline being discounted by markets may be too dovish. Of course, on the contrary, if gold prices do retake their uptrend from the March and April swing lows, it would be considered a significant bullish development in the short-term (and the aforementioned concerns are duly negated).
Gold Price Technical Analysis: Weekly Chart (October 2015 to June 2021) (Chart 3)
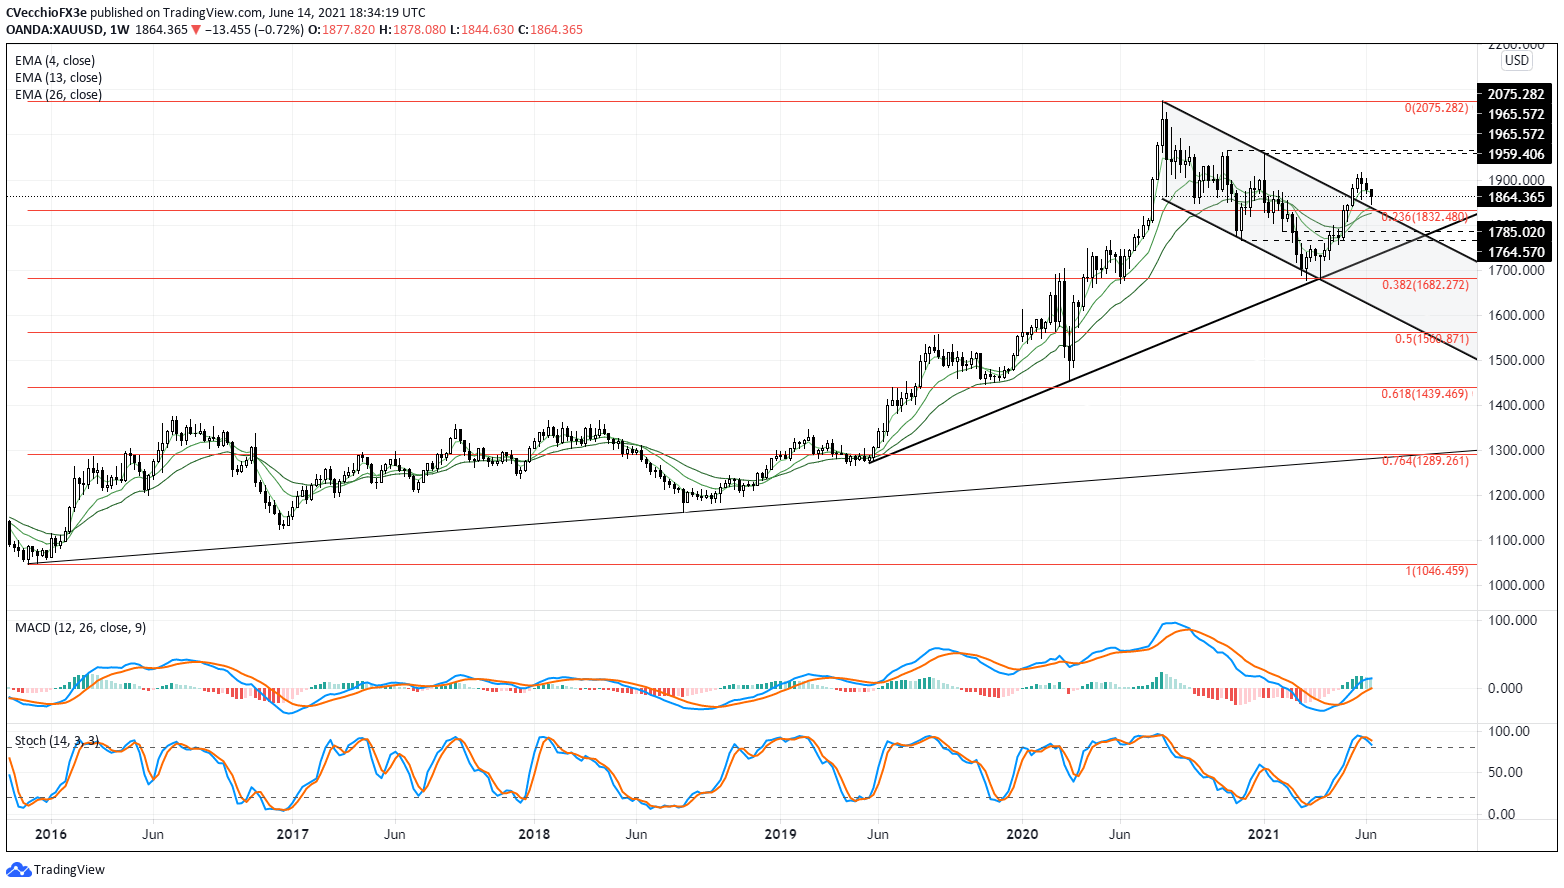
It’s been previously noted that “If gold prices are above1837 by June 15, then it would appear that gold prices would be on track to pace towards new highs by the end of the year. The conditions are being met to suggest that the bull flag breakout has started, and the march back to all-time highs has begun.” Furthermore, “as long as the technical studies remain supportive, the modus operandi is to ‘buy the dip,’ insofar as a bullish breakout from a multi-month bull flag necessitates a bullish trading posture on a longer-term basis.”
This thesis is being tested in real-time around the FOMC meeting; a change in outlook may soon be necessitated. We’ll have a better idea later this week.

IG CLIENT SENTIMENT INDEX: GOLD PRICE FORECAST (June 14, 2021) (CHART 4)

Gold: Retail trader data shows 76.09% of traders are net-long with the ratio of traders long to short at 3.18 to 1. The number of traders net-long is 3.68% higher than yesterday and 9.80% higher from last week, while the number of traders net-short is 8.07% higher than yesterday and 5.09% higher from last week.
We typically take a contrarian view to crowd sentiment, and the fact traders are net-long suggests Gold prices may continue to fall.
Positioning is less net-long than yesterday but more net-long from last week. The combination of current sentiment and recent changes gives us a further mixed Gold trading bias.
--- Written by Christopher Vecchio, CFA, Senior Currency Strategist


