


Gold Price Outlook:
- Gold prices have rebounded after returning to former resistance, a technical sign that momentum remains structurally bullish.
- A slew of inflation data and central bank rate decision through the middle of the week has intensified the risk around gold prices in the coming days.
- According to the IG Client Sentiment Index, gold prices have a mixed bias in the near-term.
Regaining Shine
Gold prices took a hit through the first week of June until the disappointing May US nonfarm payrolls report on Friday undercut US Treasury yields and the US Dollar. The combination of weaker than expected labor market data (which feeds into consumption, and thus, growth) and sustained higher commodity prices has reinvigorated the churn of higher inflation expectations and lower nominal yields, thereby curating an environment of deepening negative US real yields.
Gold prices typically enjoy a tailwind when US real yields are pointing lower, allowing the near-term technical picture to gain some bullish clarity.Risk around gold prices in the coming days has been intensified with a slew of inflation data and central bank rate decision through the middle of the week.

Gold Volatility, Gold Prices Decoupling
Historically, gold prices have a relationship with volatility unlike other asset classes. While other asset classes like bonds and stocks don’t like increased volatility – signaling greater uncertainty around cash flows, dividends, coupon payments, etc. – gold tends to benefit during periods of higher volatility.
GVZ (Gold Volatility) Technical Analysis: Daily Price Chart (June 2020 to June 2021) (Chart 1)
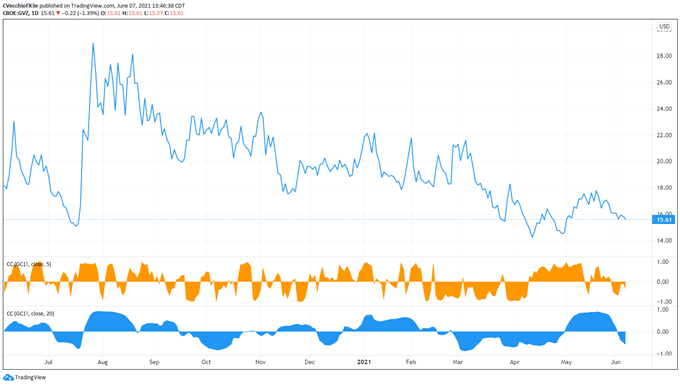
Gold volatility (as measured by the Cboe’s gold volatility ETF, GVZ, which tracks the 1-month implied volatility of gold as derived from the GLD option chain) is trading at 15.61, still holding near its four-week low. Despite contracting gold volatility, gold prices are holding onto their gains (typically a bullish development for gold). The 5-day correlation between GVZ and gold prices is -0.36 while the 20-day correlation is -0.59. One week ago, on May 31, the 5-day correlation was -0.52 and the 20-day correlation was +0.38.
Gold Price Rate Technical Analysis: Daily Chart (March 2020 to June 2021) (Chart 2)
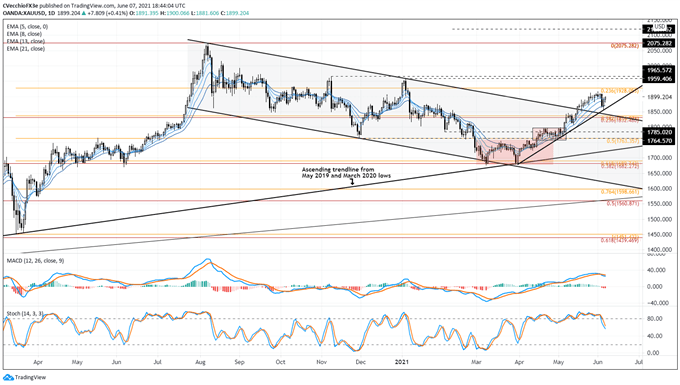
In the prior gold price forecast, it was noted that “gold prices have fallen below their daily 13-EMA for the first time since May 5. A deeper pullback to the uptrend from the March and April swing lows is possible; support would come in closer to 1850 through the end of the week.” Gold prices hit a low of 1856.04 before responding to the uptrend from the March and April swing lows as support.
In fact, considering that this uptrend constitutes the move that saw long-term bull flag resistance break in early-May, it may be considered that the pullback at the start of June was the breakout retest. It would also be the case that this means the path of least resistance is once more higher for gold prices.
Gold’s bullish momentum is starting to reassert itself. Daily MACD’s contract in bullish territory has started to slow, while daily Slow Stochastics’ drop from overbought territory has been curtailed. Gold prices have climbed above their daily 5-, 8-, 13-, and 21-EMA envelope, which is in bullish sequential order.
Gold Price Technical Analysis: Weekly Chart (October 2015 to June 2021) (Chart 3)
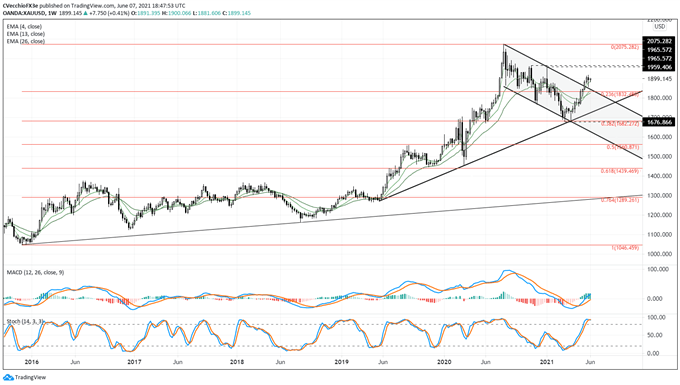
It’s been previously noted that “If gold prices are above1837 by June 15, then it would appear that gold prices would be on track to pace towards new highs by the end of the year. The conditions are being met to suggest that the bull flag breakout has started, and the march back to all-time highs has begun.” It’s again the case that, “as long as the technical studies remain supportive, the modus operandi is to ‘buy the dip,’ insofar as a bullish breakout from a multi-month bull flag necessitates a bullish trading posture on a longer-term basis.”

IG CLIENT SENTIMENT INDEX: GOLD PRICE FORECAST (June 7, 2021) (CHART 4)
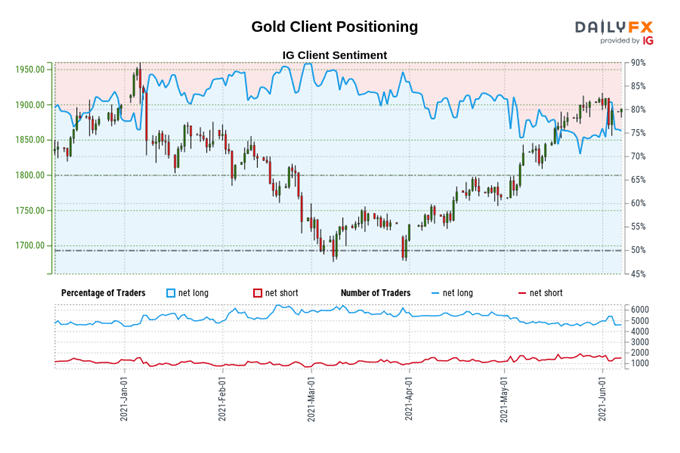
Gold: Retail trader data shows 75.28% of traders are net-long with the ratio of traders long to short at 3.05 to 1. The number of traders net-long is 5.55% higher than yesterday and 0.21% higher from last week, while the number of traders net-short is 5.71% higher than yesterday and 7.87% lower from last week.
We typically take a contrarian view to crowd sentiment, and the fact traders are net-long suggests Gold prices may continue to fall.
Positioning is less net-long than yesterday but more net-long from last week. The combination of current sentiment and recent changes gives us a further mixed Gold trading bias.
--- Written by Christopher Vecchio, CFA, Senior Currency Strategist


