


Gold Price Outlook:
- Gold prices have held above multi-month bull flag resistance, increasing confidence that a march back to all-time highs has begun.
- Weakness in US Treasury yields and the US Dollar (via the DXY Index) are helping give gold prices a fundamental boost on Monday.
- According to the IG Client Sentiment Index, gold prices have a mixed bias in the near-term.
Holding onto Gains
Gold prices have continued their advance at the start of the new week gaining just over +0.1% as both US Treasury yields and the US Dollar (via the DXY Index) have softened. Markets continue to keep a close eye on the cryptocurrency world after another wave of intense selling over the weekend was met by a fresh round of dip buyers. Given gold’s success during the cryptocurrency selloff, there’s a strong case to be made that further weakness in crypto markets could help cater to higher gold prices in the near-term.

Gold Volatility Eases Off, Gold Prices Don’t
Historically, gold prices have a relationship with volatility unlike other asset classes. While other asset classes like bonds and stocks don’t like increased volatility – signaling greater uncertainty around cash flows, dividends, coupon payments, etc. – gold tends to benefit during periods of higher volatility.
GVZ (Gold Volatility) Technical Analysis: Daily Price Chart (May 2020 to May 2021) (Chart 1)
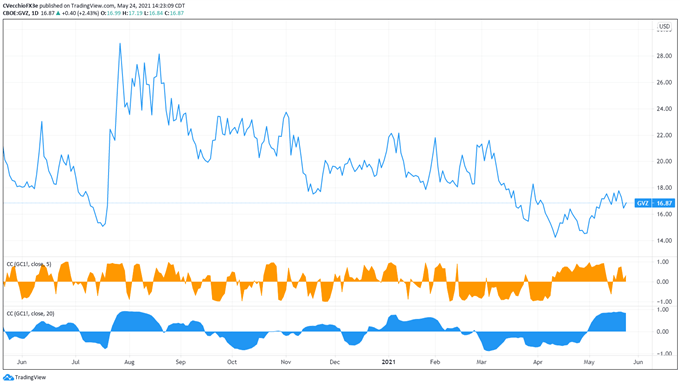
Gold volatility (as measured by the Cboe’s gold volatility ETF, GVZ, which tracks the 1-month implied volatility of gold as derived from the GLD option chain) is trading at 16.87, having back off a near two month high. holding near their highest level since the end of March. It’s noteworthy that the dip in gold volatility has not been met by a drop in gold prices (typically a bullish development for gold). The 5-day correlation between GVZ and gold prices is +0.32 while the 20-day correlation is +0.83. One week ago, on May 12, the 5-day correlation was +0.33 and the 20-day correlation was +0.89.
Gold Price Technical Analysis: Daily Chart (March 2020 to May 2021) (Chart 2)
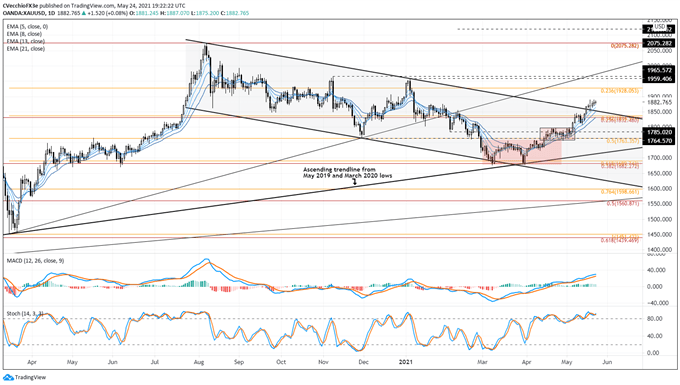
In the prior gold price forecast, it was noted that “even if the daily doji candle hints at potential indecision after the recent leg up – thereby allowing for some technical breathing room – as long as the technical studies remain supportive, the modus operandi is to ‘buy the dip,’ insofar as a bullish breakout from a multi-month bull flag necessitates a bullish trading posture on a longer-term basis.” This remains the case.
Gold’s bullish momentum has accelerated since the last update, with daily MACD extending its advance above its signal line while daily Slow Stochastics are holding in overbought territory. Furthermore, gold prices remain above their daily 5-, 8-, 13-, and 21-EMA envelope, with no closes by gold prices below their daily 5-EMA over the past two weeks.
Gold Price Technical Analysis: Weekly Chart (October 2015 to May 2021) (Chart 3)
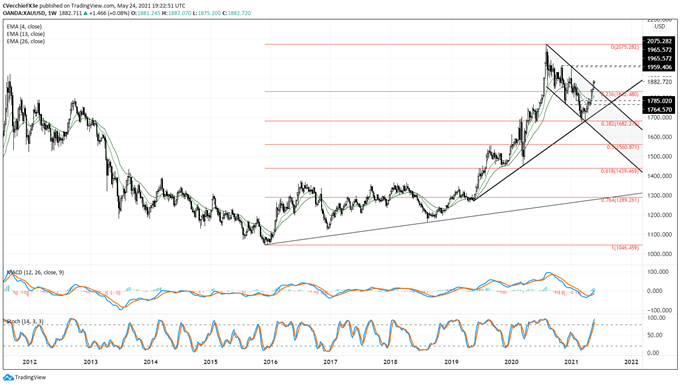
It’s been previously noted that “while the broader confines of the descending parallel channel that’s been forming relative to the August 2020 (all-time) high remain in place, now back above 1763.36, the rebound gives long-term bulls hope that by holding the pandemic uptrend, gold prices are defining their nine-month downturn as a bull flag. If gold prices are above1837 by June 15, then it would appear that gold prices would be on track to pace towards new highs by the end of the year.” The conditions are being met to suggest that the bull flag breakout has started, and the march back to all-time highs has begun.

IG CLIENT SENTIMENT INDEX: GOLD PRICE FORECAST (May 24, 2021) (CHART 4)
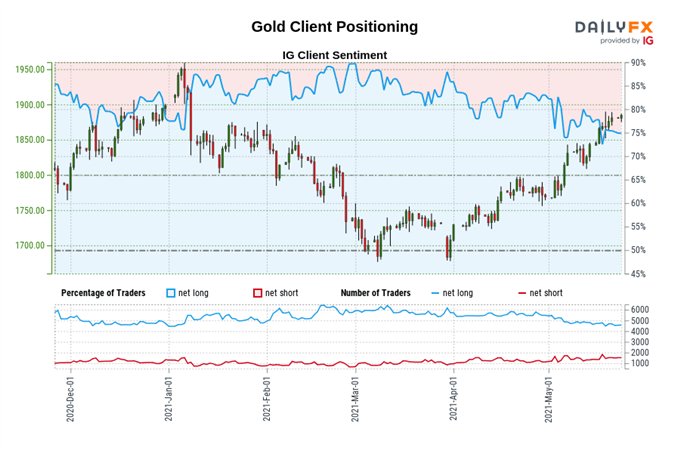
Gold: Retail trader data shows 74.95% of traders are net-long with the ratio of traders long to short at 2.99 to 1. The number of traders net-long is 4.80% higher than yesterday and 2.16% lower from last week, while the number of traders net-short is 5.38% higher than yesterday and 5.93% higher from last week.
We typically take a contrarian view to crowd sentiment, and the fact traders are net-long suggests Gold prices may continue to fall.
Yet traders are less net-long than yesterday and compared with last week. Recent changes in sentiment warn that the current Gold price trend may soon reverse higher despite the fact traders remain net-long.
--- Written by Christopher Vecchio, CFA, Senior Currency Strategist


