


Gold Technical Price Outlook: XAU/USD Weekly Trade Levels
- Gold price updated technical trade levels - Weekly Chart
- XAU/USD breakdown approaches first major technical support near the November Lows
- New to Gold Trading? Get started with this Free How to Trade Gold -Beginners Guide
Gold prices have plunged more than 2.7% since the start of the week with XAU/USD continuing to trade within the broader August downtrend. The sell-off is now approaching the first major test of technical support and we’re looking for a reaction just lower for guidance. These are the updated targets and invalidation levels that matter on the gold weekly charts heading into the close of the month. Review my latest Weekly Strategy Webinar for an in-depth breakdown of this gold technical setup and more.
Gold Price Chart - XAU/USD Weekly
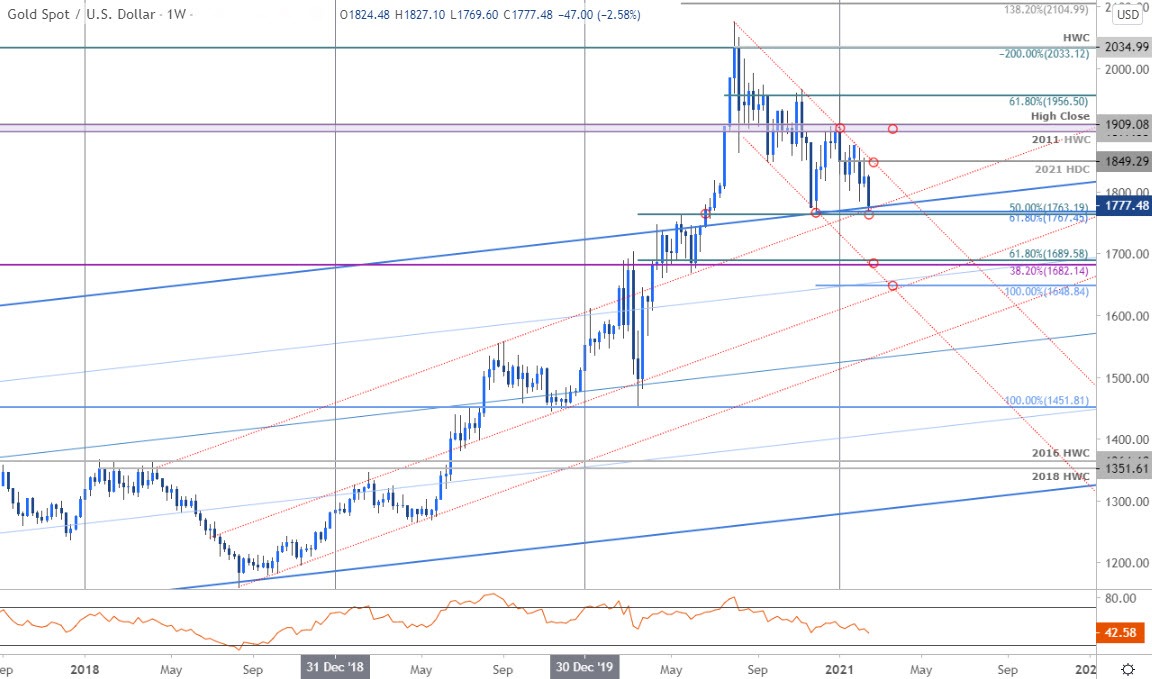
Chart Prepared by Michael Boutros, Technical Strategist; Gold on Tradingview
Notes: In last month’s Gold Weekly PriceOutlook we highlighted that the, “threat for a larger correction remains while below 1909 – look for topside exhaustion ahead of this threshold on recoveries IF price is heading lower.” The XAU/USD rally failed at channel resistance into the open of February trade (high registered at 1871) before turning lower with the losses accelerating this week as prices plummet to fresh multi-month lows.
The decline is approaching the first major support confluence at the 50% Fibonacci retracement of the 2020 range / 61.8% extension of the August decline at 1763/67- looking for a larger reaction with a break / weekly close below needed to mark resumption towards subsequent Fibonacci support objectives at 1682/89 and 1649 (both zones of interest for possible downside exhaustion IF reach). Initial resistance / bearish invalidation now lowered to the upper monthly open / 2021 high-week close at 1849 with a breach / close above 1909 ultimately needed to validate a larger reversal.

Bottom line: The gold price sell-off is now targeting confluence support near the November lows around 1763/67 and we’re looking for inflection here- a good region to reduce short-exposure / lower protective stops. Look for topside exhaustion ahead of the monthly open IF price is heading lower. Note that a break below this confluence zone would likely yield another leg of accelerated losses- stay nimble here and watch the weekly close. I’ll publish an updated Gold Price Outlook once we get further clarity on the near-term XAU/USD technical trading levels.
For a complete breakdown of Michael’s trading strategy, review his Foundations of Technical Analysis series on Building a Trading Strategy
Gold Trader Sentiment – XAU/USD Price Chart

- A summary of IG Client Sentiment shows traders are net-long Gold- the ratio stands at +6.13 (85.97% of traders are long) – typically bearishreading
- Long positions are5.01% higher than yesterday and 18.60% higher from last week
- Short positions are7.58% higher than yesterday and 12.43% lower from last week
- We typically take a contrarian view to crowd sentiment, and the fact traders are net-long suggests Gold prices may continue to fall. Traders are less net-long than yesterday but more net-long from last week and the combination of current positioning and recent changes gives us a further mixed Gold trading bias from a sentiment standpoint.
| Change in | Longs | Shorts | OI |
| Daily | -2% | 7% | 2% |
| Weekly | 6% | -11% | -3% |
---
Previous Weekly Technical Charts
- Canadian Dollar (USD/CAD)
- Sterling (GBP/USD)
- Euro (EUR/USD)
- US Dollar (DXY)
- Japanese Yen (USD/JPY)
- Crude Oil (WTI)
- Australian Dollar (AUD/USD)
- Written by Michael Boutros, Currency Strategist with DailyFX
Follow Michael on Twitter @MBForex


