


Gold Technical Price Outlook: XAU/USD Near-term Trade Levels
- Gold price updated technical trade levels – Daily & Intraday Charts
- XAU/USD recovery vulnerable while below key technical resistance at ~1900
- New to Gold Trading? Get started with this Free How to Trade Gold -Beginners Guide
Gold prices are trading into the recent range highs early in the week as XAU/USD looks to test longer-term downtrend resistance. The focus remains on possible price inflection just higher for guidance in the days ahead as markets continue to digest the barrage of Game Stop headlines and the accompanying volatility. These are the updated targets and invalidation levels that matter on the XAU/USD technical charts heading into the close of the week. Review my latest Strategy Webinar for an in-depth breakdown of this gold technical setup and more.
Gold Price Chart - XAU/USD Daily
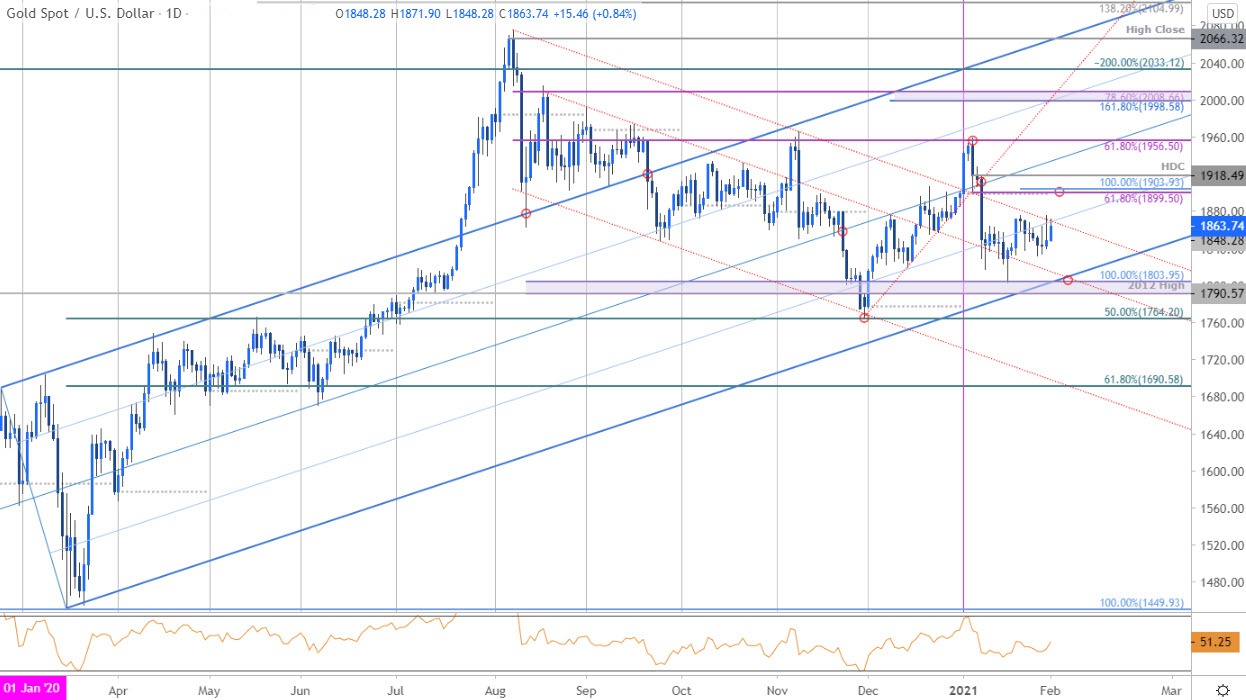
Chart Prepared by Michael Boutros, Technical Strategist; Gold on Tradingview
Technical Outlook: In my last Gold Price Outlook we noted that a reversal off key Fibonacci resistance left the XAU/USD vulnerable into the start of the year with the risk, “for a larger setback while below 1918/20…” Price plummeted a full 8% off the January highs before rebounding off confluence support at the 2012 swing high / 100% extension at 1790-1803.
The recovery has stalled at downtrend resistance (red) extending off the 2020 highs and we’re looking for inflection off this threshold. A breach / close is needed to keep the focus higher with such a scenario exposing critical resistance at 1899-1903- a region defined by the 61.8% Fibonacci retracement of the January range, the 100% extension off the recent advance and the objective 2021 yearly open. Look for a larger reaction there IF reached with a breach above the yearly high-day close at 1918 needed to mark resumption of the broader uptrend.
Gold Price Chart - XAU/USD 120min
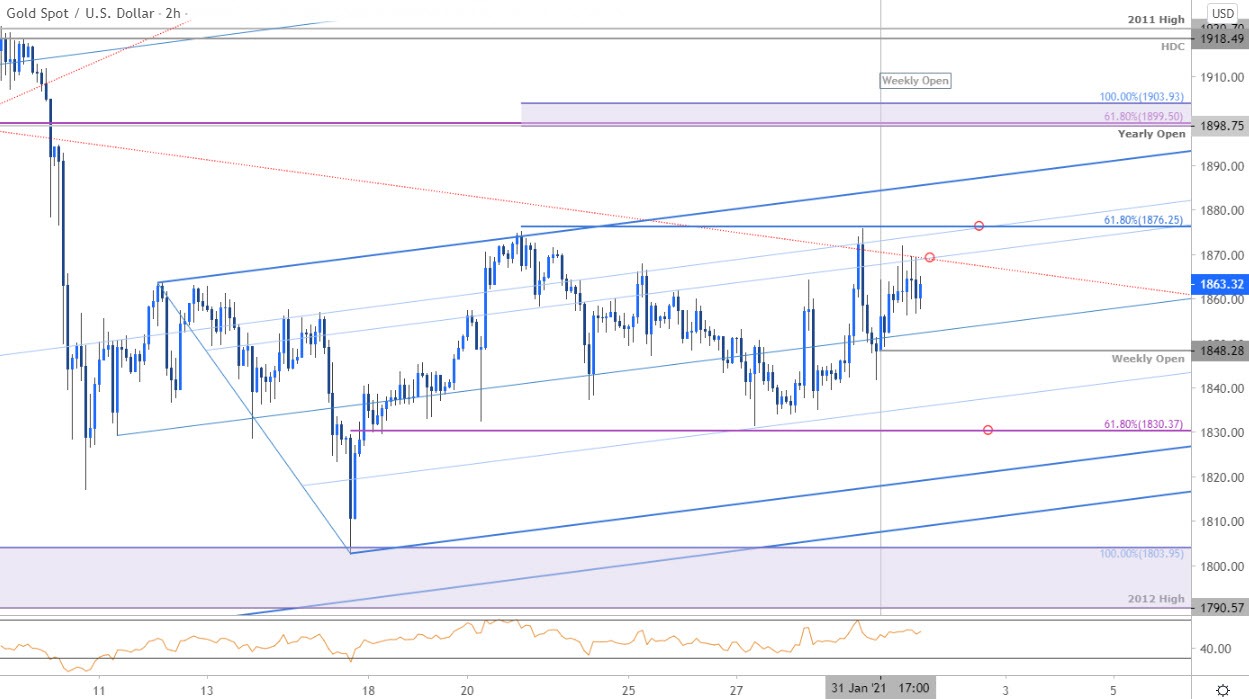
Notes: A closer look at Gold price action shows XAU/USD trading within the confines of an ascending pitchfork formation extending off the yearly lows. Initial resistance eyed at the highlighted trendline confluence backed closely by the 61.8% extension at 1876 – look for a reaction there IF reached. Weekly open support at 1848 backed by the lower parallels with a break / close below 1830 needed to shift the focus back towards key support again at 1790-1803.

Bottom line: The recent Gold recovery may be vulnerable here into 1876. From a trading standpoint, a good zone to reduce long-exposure / raise protective stops – be on the lookout for possible topside exhaustion ahead of the upper parallel IF price is indeed heading lower. Ultimately, a larger setback may offer more favorable opportunities with a breach / close above 1903 needed to put the bulls back in control. Stay nimble as we head into the February opening-range with break likely to offer further clarity on our near-term directional bias. Review my latest Gold Weekly Price Outlook for a closer look at the longer-term XAU/USD technical trading levels.
For a complete breakdown of Michael’s trading strategy, review his Foundations of Technical Analysis series on Building a Trading Strategy
Gold Trader Sentiment – XAU/USD Price Chart
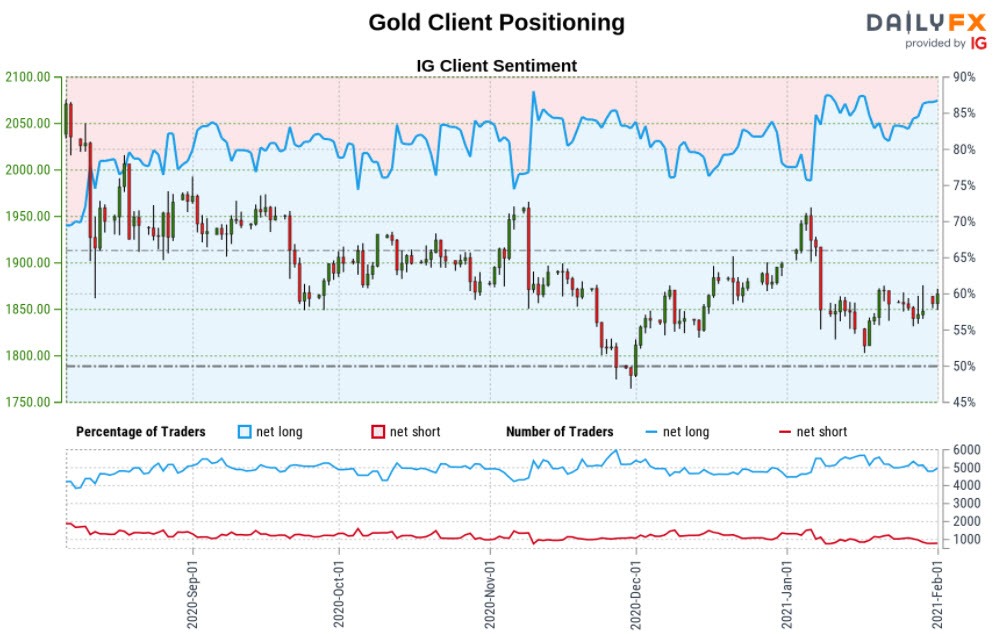
- A summary of IG Client Sentiment shows traders are net-long Gold- the ratio stands at +5.11 (83.62% of traders are long) – typically bearishreading
- Long positions are6.84% higher than yesterday and 1.84% higher from last week
- Short positions are 33.60% higher than yesterday and 11.21% lower from last week
- We typically take a contrarian view to crowd sentiment, and the fact traders are net-long suggests Gold prices may continue to fall. Traders are less net-long than yesterday but more net-long from last week. The combination of current positioning and recent changes gives us a further mixed Gold trading biasfrom a sentiment standpoint
| Change in | Longs | Shorts | OI |
| Daily | -6% | 9% | 0% |
| Weekly | 9% | -14% | -4% |
---
Active Technical Setups
- US Dollar Outlook: USD Snaps Back- Are Bears Taking Control?
- Canadian Dollar Outlook: USD/CAD BoC Breakdown– Loonie Levels
- Mexican Peso Outlook: USD/MXN Breakdown to Nine-month Lows
- Australian Dollar Outlook: Aussie Building Breakout- AUD/USD Levels
- Written by Michael Boutros, Technical Strategist with DailyFX
Follow Michael on Twitter @MBForex


