


Gold, Silver, Precious Metals, XAG/USD, XAU/USD – Talking Points:
- Gold prices eyeing a push to test Descending Channel resistance.
- Silver poised to extend recent climb as prices carve out a Bull Flag continuation pattern.
As mentioned in previous reports, gold and silver prices look set to the extend their respective rebounds higher as bullish technical setups begin to take shape across multiple timeframes. Here are the key levels to watch for both precious metals.
Gold Price Daily Chart – Eyeing Descending Channel Resistance
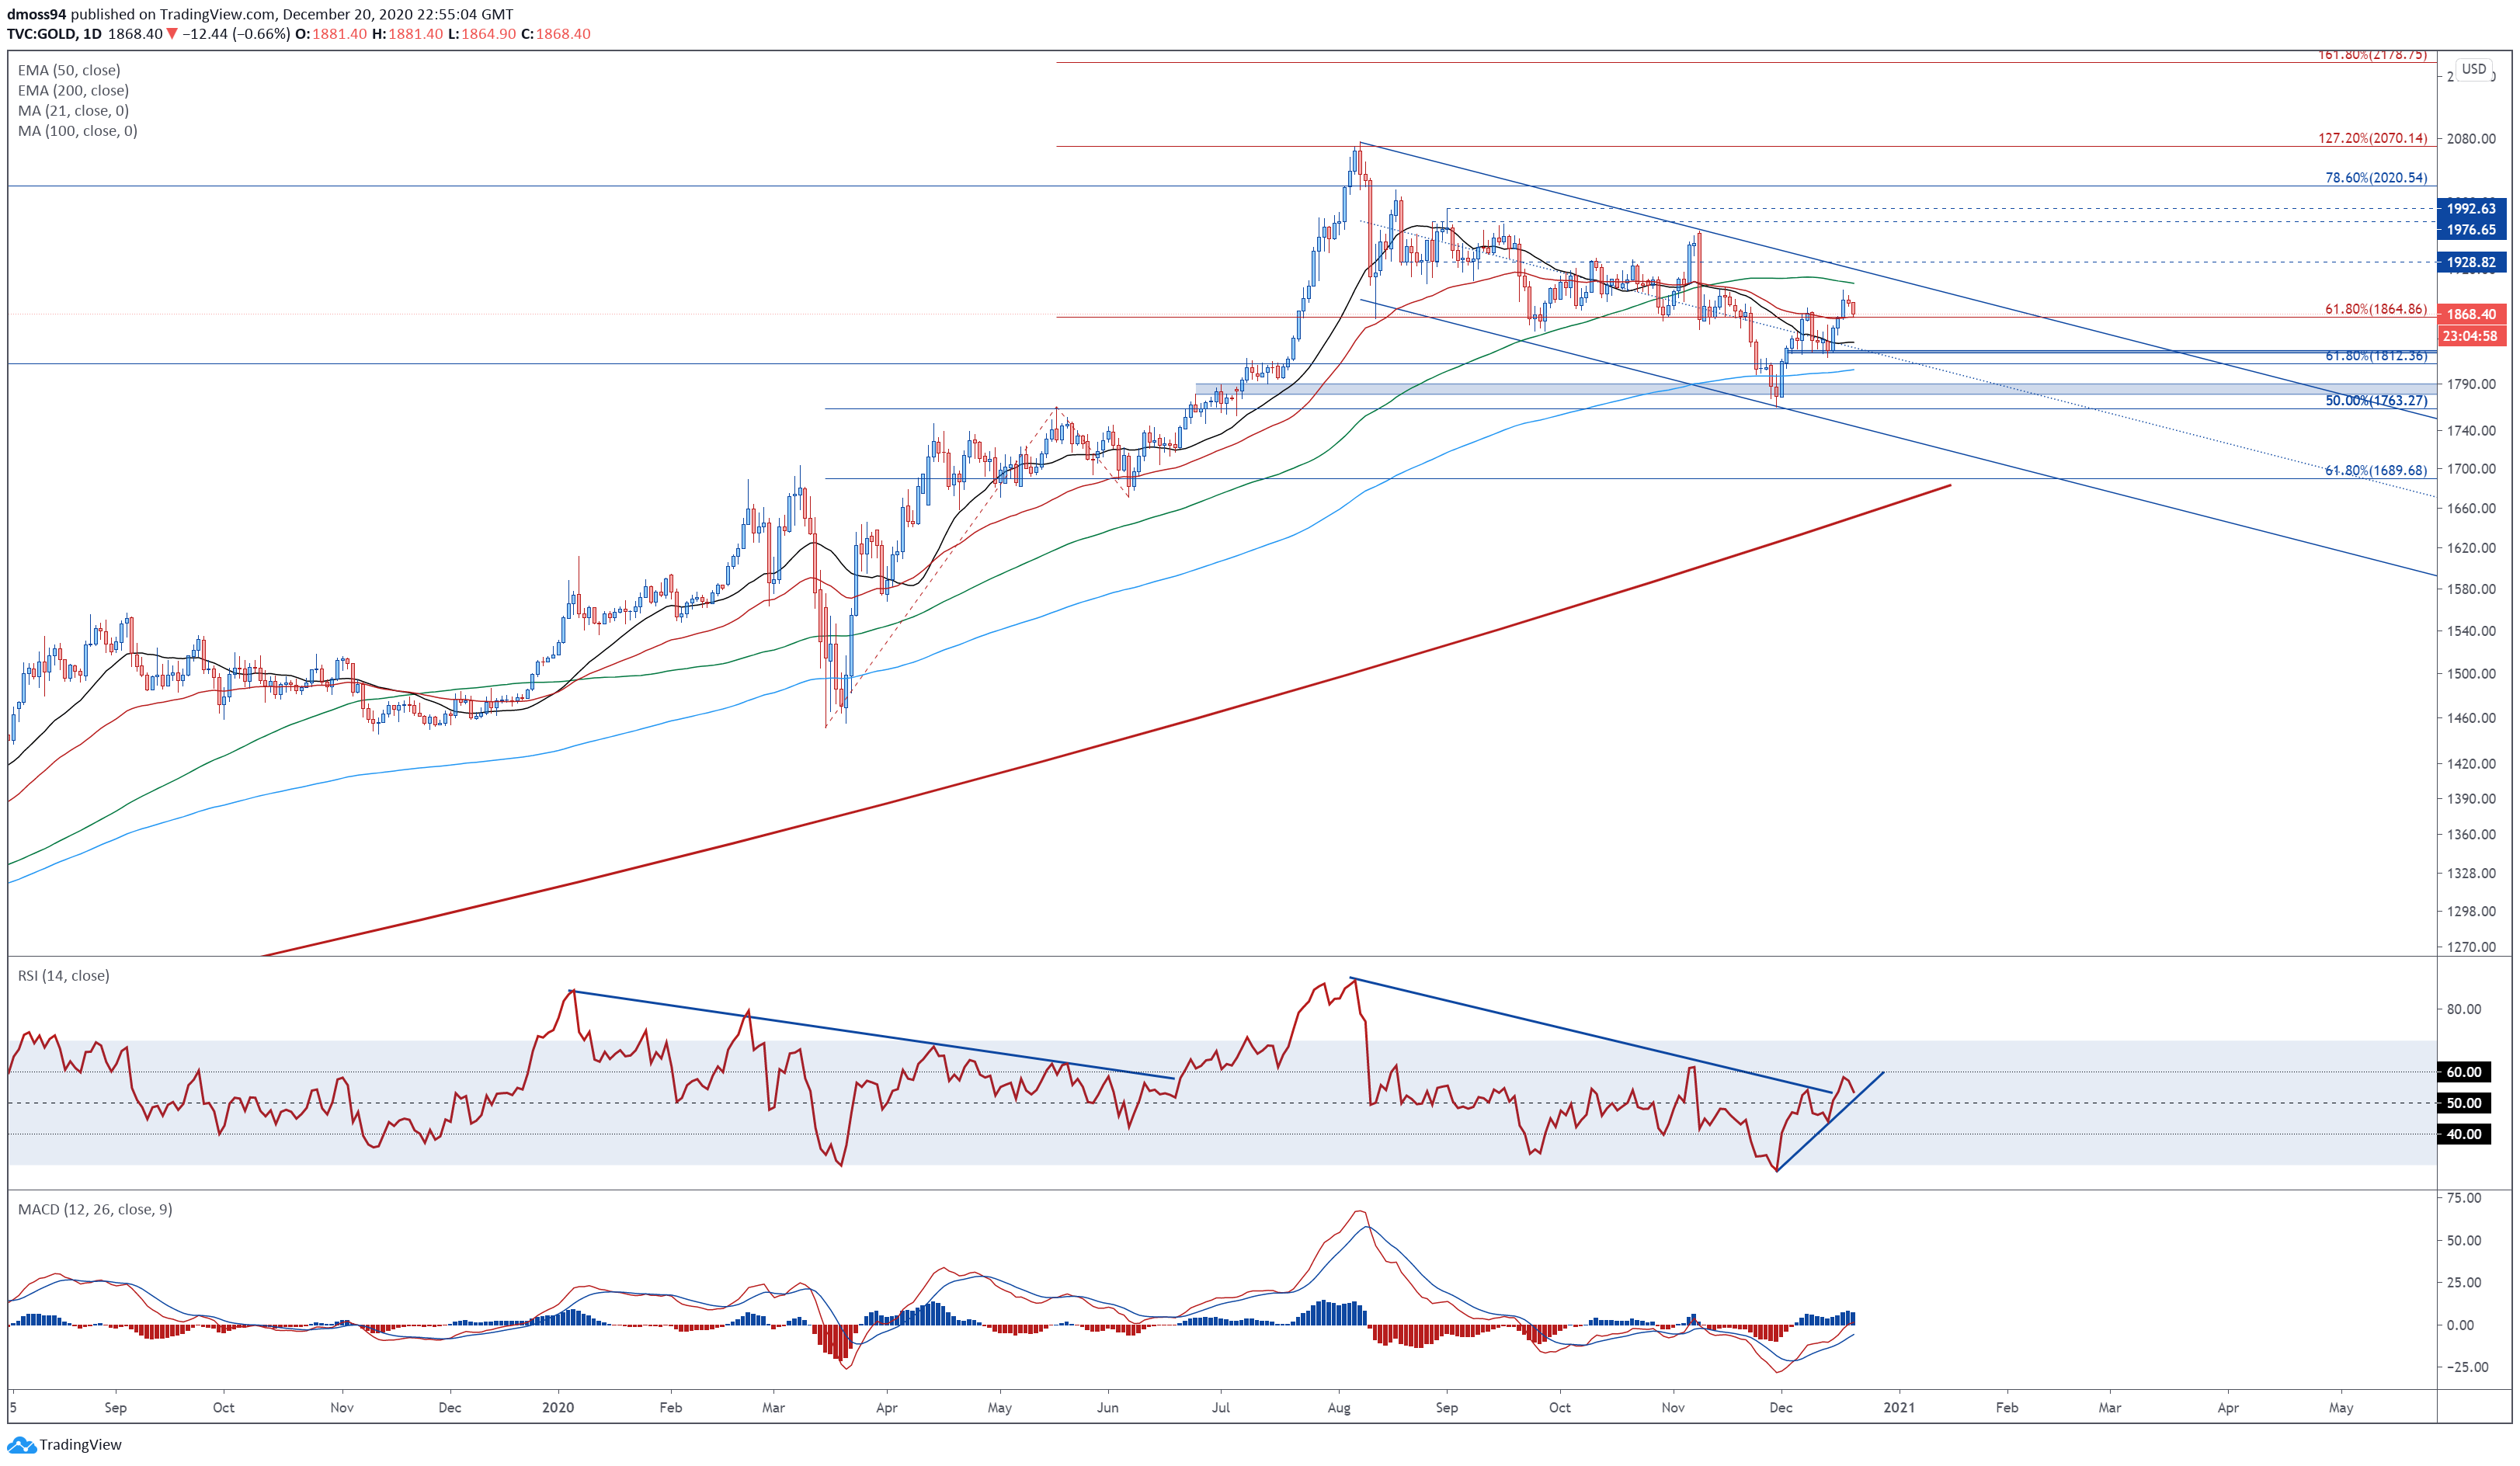
Gold price daily chart created using Tradingview
Gold looks set to extend its rebound from the November low (1764.73), as prices burst back above the trend-defining 50-day moving average and the 61.8% Fibonacci (1864.86).
With the RSI eyeing a push back above 60 into bullish territory, and a bullish cross over taking place on the MACD indicator, the path of least resistance seems to favour the upside.
Gaining a firm foothold above the December 17 high (1896.29) on a daily close basis would probably neutralize near-term selling pressure and carve a path for prices to challenge Descending Channel resistance and the 100-MA (1904.13).
Clearing that probably invalidates the bearish continuation pattern and opens the door for buyers to drive gold prices back towards the November 9 high (1965.55).
Alternatively, sliding back below the 1864 mark could allow sellers to regain control and drive price back towards the support range at 1825 – 1828.
Gold Price 4-Hour Chart – Golden Cross Points to Extended Gains

Gold price 4-hour chart created using Tradingview
Zooming into the 4-hour chart bolsters the bullish outlook depicted on the daily timeframe, as prices remain constructively perched above key support at the 61.8% Fibonacci (1873.12).
A golden cross moving average formation, in tandem with the RSI eyeing a push into overbought territory, hints at building bullish momentum and suggests and extended topside push could be in the offing.
Breaching resistance at the 88.6% Fibonacci (1895.52) would probably signal the resumption of the monthly uptrend and bring the psychologically imposing 1910 level into play.
Clearing that likely intensifies buying pressure in the near term and may generate a push to retest the November high (1965.55).
On the other hand, collapsing back below the 21-MA (1871.20) could inspire a pullback towards the December 4 high (1848.21).
Silver Price Daily Chart – Descending Triangle Break Hints at Further Upside

Silver price daily chart created using Tradingview
Silver prices also look poised to continue pushing higher as prices remain constructively perched above the October high (25.56), after slicing through Descending Triangle resistance.
With the RSI eyeing a push into overbought territory, and the MACD indicator clambering back above its neutral midpoint for the first time since September, the path of least resistance seems higher.
A daily close above psychological resistance at 26.00 would likely signal the resumption of the primary uptrend and carve a path for prices to test the September high (28.90).
The Descending Triangle’s implied measured move suggesting silver may climb an additional 25% from current levels to test the 32.00 mark.
Conversely, piercing back below psychological support at 25 could inspire a short-term pullback towards the trend-defining 50-DMA (24.37).
Silver Price 4-Hour Chart – Bull Flag in Play

Silver price 4-hour chart created using Tradingview
The 4-hour chart also hints that an extended topside push could be on the cards, as prices carve out a Bull Flag continuation pattern just shy of psychological resistance at 26.00.
A convincing break above flag resistance (26.12) is needed to validate the bullish pattern and signal the resumption of the uptrend extending from the November low (21.87).
The pattern’s implied measured move suggesting prices could climb a further 5.5% from current levels to test resistance at the September 15 high (27.62).
On the contrary, slicing back below 25.50 could generate a downside push back towards support at 24.80.
-- Written by Daniel Moss, Analyst for DailyFX
Follow me on Twitter @DanielGMoss


