


Gold Technical Price Outlook: XAU/USD Weekly Trade Levels
- Gold price updated technical trade levels - Weekly Chart
- XAU/USD recovery off confluence support in focus– bearish invalidation steady at 1909
- New to Gold Trading? Get started with this Free How to Trade Gold -Beginners Guide
Gold prices rallied more than 3.8% since the start of December with XAU/USD rebounding off technical support early in the month. The recovery has stalled below the first lateral resistance and while the broader focus remains constructive, the risk remains for a deeper setback while below near-term downtrend resistance. These are the updated targets and invalidation levels that matter on the gold weekly charts heading into the FOMC interest rate decision tomorrow. Review my latest Weekly Strategy Webinar for an in-depth breakdown of this gold technical setup and more.
Gold Price Chart - XAU/USD Weekly

Chart Prepared by Michael Boutros, Technical Strategist; Gold on Tradingview
Notes: In my last Gold Weekly PriceOutlook we noted that XAU/USD had responded to downtrend support and to be, “on the lookout for evidence of a low in price – it’s either one more drop into 1739 to complete two-equal legs off the high (marking correction) OR a breach above 1909 to mark resumption.” Nearly two-weeks later and the outlook remains unchanged – the focus is on this recovery in price with the rebound still trading within the confines of the broader August decline.
Initial weekly resistance steady at the September lows at 1849 backed by key resistance / bearish invalidation at the 2011 high-week close / high-close at 1898-1909 – a close above this region would be needed to shift the broader focus back to the topside towards the 61.8% Fibonacci retracement at 1956. Weekly support steady at 1763 backed by the 100% extension at 1739- still an area if interest for downside exhaustion IF reached.

Bottom line: Gold’s recovery off confluence support is entering its third week and challenging the first lateral resistance level at 1849- watch the weekly close with respect to this threshold. From a trading standpoint, the threat remains for a deeper setback while within this formation but we’re ultimately looking to confirm a low in the weeks ahead with a test of 1739 or a close above 1909 to offer fresh opportunities for the broader gold price rally. Stay nimble into the FOMC tomorrow. Review my latest Gold Price Outlook for a closer look at the near-term XAU/USD technical trading levels.
For a complete breakdown of Michael’s trading strategy, review his Foundations of Technical Analysis series on Building a Trading Strategy
Gold Trader Sentiment – XAU/USD Price Chart
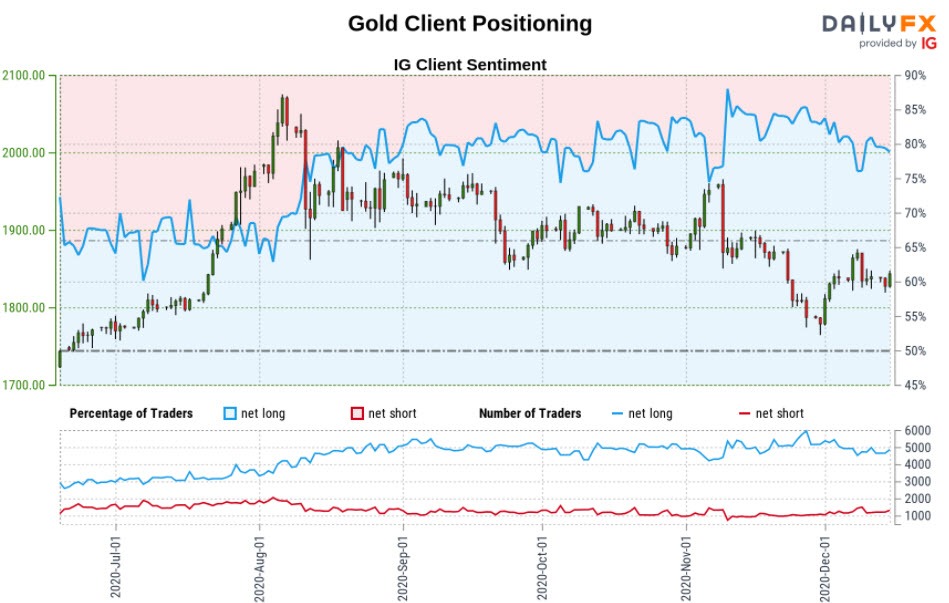
- A summary of IG Client Sentiment shows traders are net-long Gold- the ratio stands at +3.11 (75.67% of traders are long) – typically bearishreading
- Long positions are1.37% higher than yesterday and 1.50% lower from last week
- Short positions are4.19% higher than yesterday and 9.98% higher from last week
- We typically take a contrarian view to crowd sentiment, and the fact traders are net-long suggests Gold prices may continue to fall. Yet traders are less net-long than yesterday and compared with last week. Recent changes in sentiment warn that the current Gold price trend may soon reverse higher despite the fact traders remain net-long
| Change in | Longs | Shorts | OI |
| Daily | -3% | -1% | -2% |
| Weekly | 10% | -14% | -4% |
---
Previous Weekly Technical Charts
- Sterling (GBP/USD)
- US Dollar (DXY)
- Gold (XAU/USD)
- Euro (EUR/USD)
- Australian Dollar (AUD/USD)
- Canadian Dollar (USD/CAD)
- Written by Michael Boutros, Currency Strategist with DailyFX
Follow Michael on Twitter @MBForex


