


Precious Metals, Gold Prices, Silver Prices, XAU/USD, XAG/USD – Talking Points:
- Gold and silver prices have notably recovered since plunging to multi-month lows at the end of November.
- The recovery in precious metal prices looks set to endure as bullish technical setups take place on multiple timeframes.
As expected, gold and silver prices have stormed higher in December, climbing 5.4% and 9.8% respectively. These gains look set to endure as bullish technical setups begin to line up across multiple time frames. Here are the key levels to watch for both precious metals.
Gold Prices Daily Chart – 21-DMA May Guide Price Higher

Gold prices daily chart created using Tradingview
Gold looks set to extend its rebound from the November low (1764.73), as prices remain constructively perched above the sentiment-defining 200-day moving average (1801.96) and psychological support at 1830.
However, with the RSI continuing to track the downtrend extending from the August extremes, and the MACD indicator travelling firmly below its neutral midpoint, the path of least resistance seems to favour the downside.
Nevertheless, a more extended rebound could be on the cards if psychological support at 1830 remains intact.
A daily close back above the 21-DMA (1843.93) would probably neutralize near-term selling pressure and open the door for a retest of the monthly high (1875.28). Clearing that could propel price towards Descending Channel resistance and the 100-DMA (1911.10).
Alternatively, breaching 1830 could generate a pullback towards the 61.8% Fibonacci (1812.36), with a daily close below bringing range support at 1780 – 1790 into focus.
Gold Prices 4-Hour Chart – Range Support Nurturing Rebound

Gold prices 4-hour chart created using Tradingview
Zooming into a 4-hour chart bolsters the bullish outlook depicted on the higher timeframes, as price rebounds robustly away from range support at 1825 – 1828.
An impulsive push to retest the 61.8% Fibonacci expansion (1873.12) looks likely if buyers can hurdle the 21-MA (1853.23)
Breaking above 1874 is probably required to carve a path for price to challenge psychological resistance at 1900 and the 100% Fibonacci (1905.05).
On the other hand, sliding below the 100-MA (1835.92) could send bullion back towards range support with a break below bringing the 61.8% Fibonacci (1812.36) into the crosshairs.
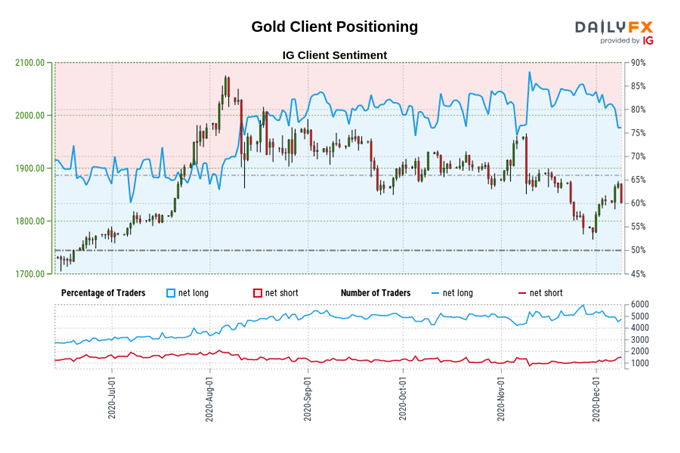
The IG Client Sentiment Report shows 79.44% of traders are net-long with the ratio of traders long to short at 3.86 to 1.The number of traders net-long is 0.64% lower than yesterday and 11.29% lower from last week, while the number of traders net-short is 12.37% lower than yesterday and 13.47% higher from last week.
We typically take a contrarian view to crowd sentiment, and the fact traders are net-long suggests Gold prices may continue to fall.
Positioning is more net-long than yesterday but less net-long from last week. The combination of current sentiment and recent changes gives us a further mixed Gold trading bias.
Silver Prices Daily Chart – Bull Pennant in Play

Silver prices daily chart created using Tradingview
The longer-term outlook for silver remains skewed to the upside as prices continue to carve out a Bull Pennant formation above the sentiment-defining 200-DMA (21.93).
However, with buyers failing to hurdle pennant resistance, and both the RSI and MACD indicators tracking marginally below their respective midpoints, a more extended pullback is hardly out of the question.
Nevertheless, a daily close above the psychologically imposing 25.00 mark would likely neutralize near-term selling pressure and open the door for prices to probe the yearly high (29.86).
On the contrary, a daily close below the 21-DMA (23.93) could propel silver prices back towards range support at 22.25 – 22.50.
Silver Prices 4-Hour Chart – Eyeing the Monthly High

Silver prices 4-hour chart created using Tradingview
The four-hour chart hints at further gains as price remains constructively perched above the 61.8% Fibonacci (23.88) and range support at 23.65 – 23.75.
Hurdling resistance at the 200-MA (24.05) would probably propel prices back towards the monthly high (24.86), with a break above clearing a path for buyers to challenge the November high (26.00).
Alternatively, pushing back below 23.60 could allow sellers to regain control and drive price back towards psychological support at 23.00.
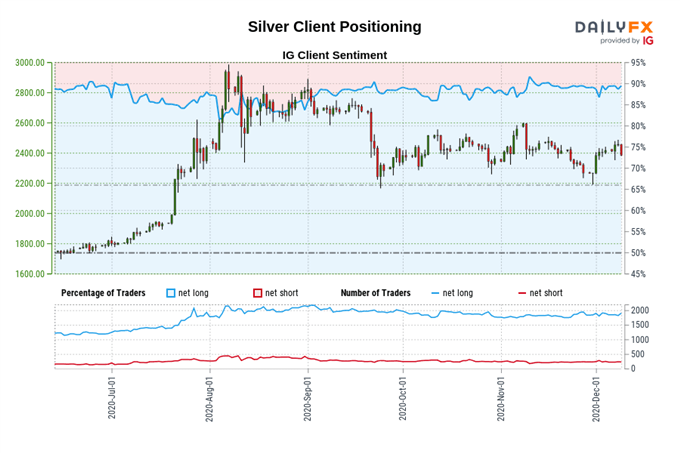
The IG Client Sentiment Report shows 88.75% of traders are net-long with the ratio of traders long to short at 7.89 to 1. The number of traders net-long is 3.39% lower than yesterday and 1.33% lower from last week, while the number of traders net-short is 6.82% higher than yesterday and 5.86% higher from last week.
We typically take a contrarian view to crowd sentiment, and the fact traders are net-long suggests Silver prices may continue to fall.
Yet traders are less net-long than yesterday and compared with last week. Recent changes in sentiment warn that the current Silver price trend may soon reverse higher despite the fact traders remain net-long.
-- Written by Daniel Moss, Analyst for DailyFX
Follow me on Twitter @DanielGMoss


