


Gold Technical Price Outlook: XAU/USD Near-term Trade Levels
- Gold price updated technical trade levels – Daily & Intraday Charts
- XAU/USD rebounds off near-term trend support- bearish invalidation at 1935
- New to Gold Trading? Get started with this Free How to Trade Gold -Beginners Guide
Gold prices are up more than 1.8% since the start of the week with XAU/USD poised for a larger recovery off downtrend support into the close of the month. These are the updated targets and invalidation levels that matter on the XAU/USD technical charts heading into the start of Q4. Review my latest Strategy Webinar for an in-depth breakdown of this gold technical setup and more.
Gold Price Chart - XAU/USD Daily

Chart Prepared by Michael Boutros, Technical Strategist; Gold on Tradingview
Technical Outlook: In my last Gold Price Outlook we highlighted the risk for a larger correction in XAU/USD while noting that, “a close below 1920 needed to shift the focus back to the downside, exposing the August low at 1863 and the 38.2% retracement at 1837.” A break below the September opening-range lows last week fueled a decline of more than 3% with gold registering a low at 1848 before rebounding off confluence trendline support near the August extremes.
An outside-day reversal off the lows yesterday highlights the threat for a larger recovery with daily resistance eyed at the 2011 swing high at 1920 and the 38.2% Fibonacci retracement of the decline off the yearly high at 1935- a breach / close above this threshold would be needed to suggest a more significant low was registered this week / a larger reversal is underway. Daily support objectives unchanged at 1837 & the 100% extension at 1803- both zones of interest for possible downside exhaustion IF reached.
Gold Price Chart - XAU/USD 120min
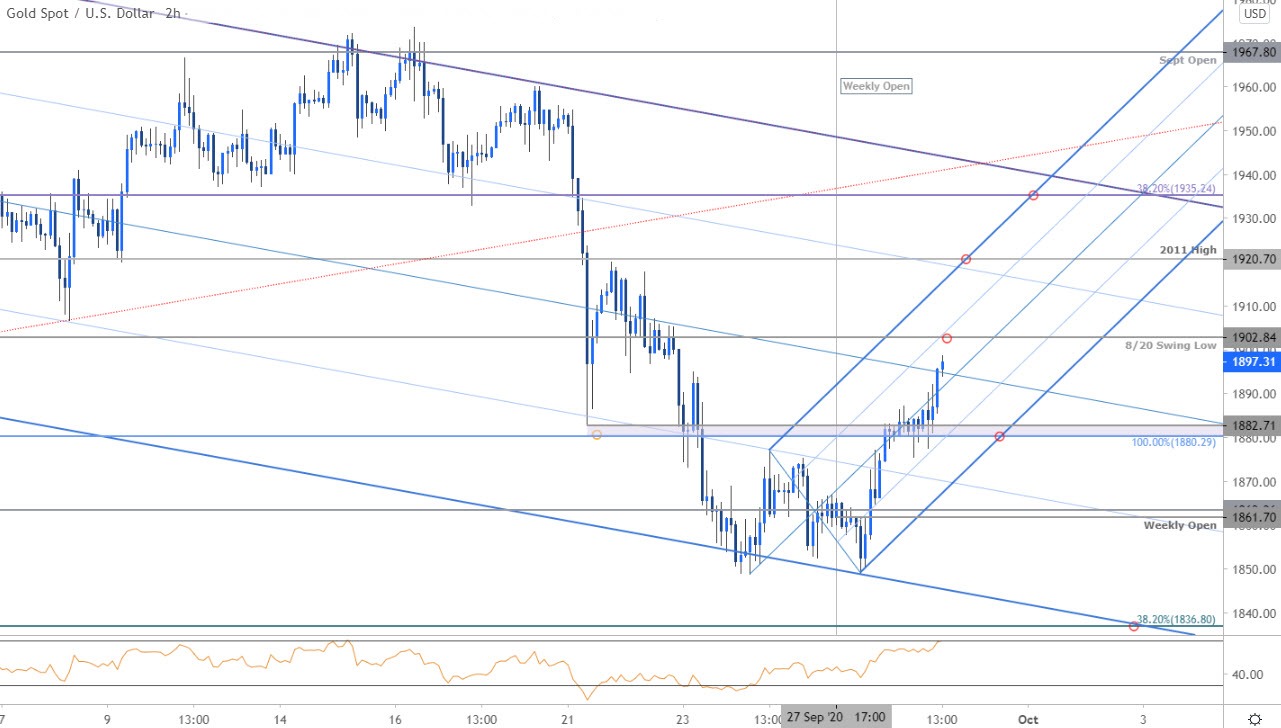
Notes: A closer look at Gold price action sees XAU/USD rebounding off the lower parallel of the descending pitchfork formation we’ve been tracking off the late-August highs with the recovery now attempting to breach the median-line. Initial resistance eyed at 1902 backed by 1920 and 1935- a zone of interest for possible topside exhaustion IF reached. The immediate advance remains viable while above 1880 with a break below the weekly open at 1861 needed to mark resumption towards 1837.

Bottom line: The gold price rebound remains constructive while within this near-term formation but the broader outlook remains tilted to the downside within the August decline. From a trading standpoint, look to reduce long-exposure / raise protective stops on a test of the upper parallels – be on the lookout for a swing high while below 1935 with a break below the weekly open needed to fuel the next leg lower in price. Ultimately, a larger correction may offer more favorable opportunities with a breach above the monthly range / 1992 needed to shift the broader focus higher again.
It’s worth noting that we’re heading into the close of the month & quarter – not the most friendly environment for intra-week swing trading. Stay nimble. Review my latest Gold Weekly Price Outlook for a closer look at the longer-term XAU/USD technical trading levels.
For a complete breakdown of Michael’s trading strategy, review his Foundations of Technical Analysis series on Building a Trading Strategy
Gold Trader Sentiment – XAU/USD Price Chart

- A summary of IG Client Sentiment shows traders are net-long Gold- the ratio stands at +4.55 (82% of traders are long) – bearishreading
- Long positions are2.81% higher than yesterday and 9.15% higher from last week
- Short positions are 2.01% lower than yesterday and 9.58% lower from last week
- We typically take a contrarian view to crowd sentiment, and the fact traders are net-long suggests Gold prices may continue to fall. Traders are further net-long than yesterday and last week, and the combination of current positioning and recent changes gives us a stronger Gold-bearish contrarian trading bias from a sentiment standpoint.
| Change in | Longs | Shorts | OI |
| Daily | -3% | -2% | -3% |
| Weekly | 9% | -18% | -5% |
---
Active Technical Setups
- Euro Dollar Outlook: EUR/USD Bounce Faces First Test- NFP Levels
- Dollar vs Mexican Peso Outlook: USD/MXN Breakout Pending
- Oil Price Outlook: Crude Caught at Resistance- WTI Breakout Pending
- S&P 500 Technical Outlook: Bears Challenge First Major Support
- Canadian Dollar Outlook: USD/CAD Breakout Levels- Bull’s First Test
- Australian Dollar Forecast: AUD/USD Plummets, Can Bulls Back the Bid?
- Written by Michael Boutros, Technical Strategist with DailyFX
Follow Michael on Twitter @MBForex


