


Gold Technical Price Outlook: XAU/USD Near-term Trade Levels
- Gold price updated technical trade levels – Daily & Intraday Charts
- XAU/USD breakout rallies through 2012 highs- constructive while above 1820
- New to Gold Trading? Get started with this Free How to Trade Gold -Beginners Guide
Gold prices are soaring for a seventh consecutive week with XAU/USD up more than 2.7% since the Sunday open. A breach above July opening-range take price towards near-term uptrend resistance and while the immediate rally may be vulnerable here, the broader focus remains constructive while within this technical formation. These are the updated targets and invalidation levels that matter on the XAU/USD technical charts in the days ahead. Review my latest Weekly Strategy Webinar for an in-depth breakdown of this gold trade setup and more.
Gold Price Chart - XAU/USD Daily
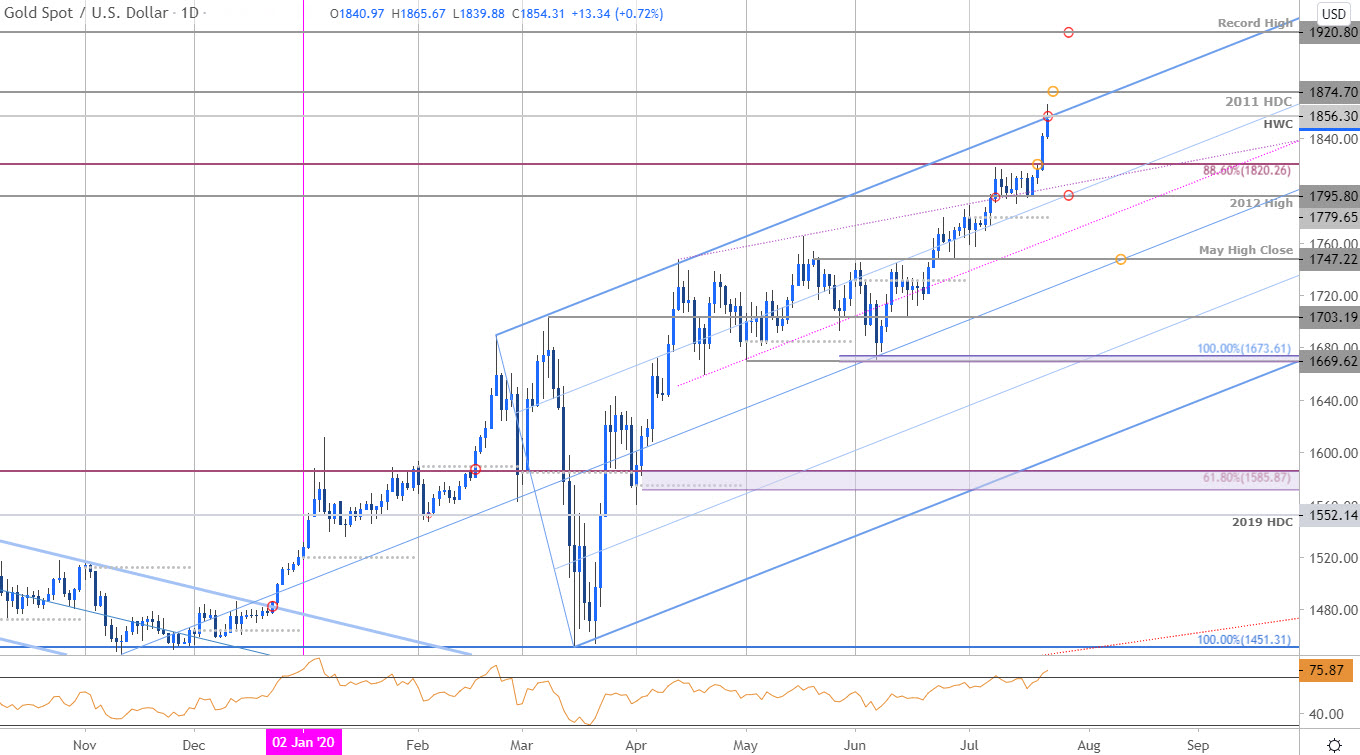
Chart Prepared by Michael Boutros, Technical Strategist; Gold on Tradingview
Technical Outlook: In my last Gold Price Outlook we noted to be on the lookout, “for downside exhaustion ahead of 1779 (July open) on pullbacks IF price is indeed heading higher with a breach above 1820 needed to fuel the next leg higher in price.” XAU/USD registered a low at 1790 in the following days before reversing sharply higher with gold marking a daily close above 1820 on an accelerated breakout yesterday.
The focus is on immediate resistance objectives here at the record high-week close at 1856 and the 2011 high-day close at 1874- a breach / close above this threshold is needed to keep the immediate advance viable towards the 2011 record stretch high at 1920. Daily support rests back at 88.6% Fibonacci retracement at 1820 with bullish invalidation now raised to the 2012 high at 1795.
Gold Price Chart - XAU/USD 120min
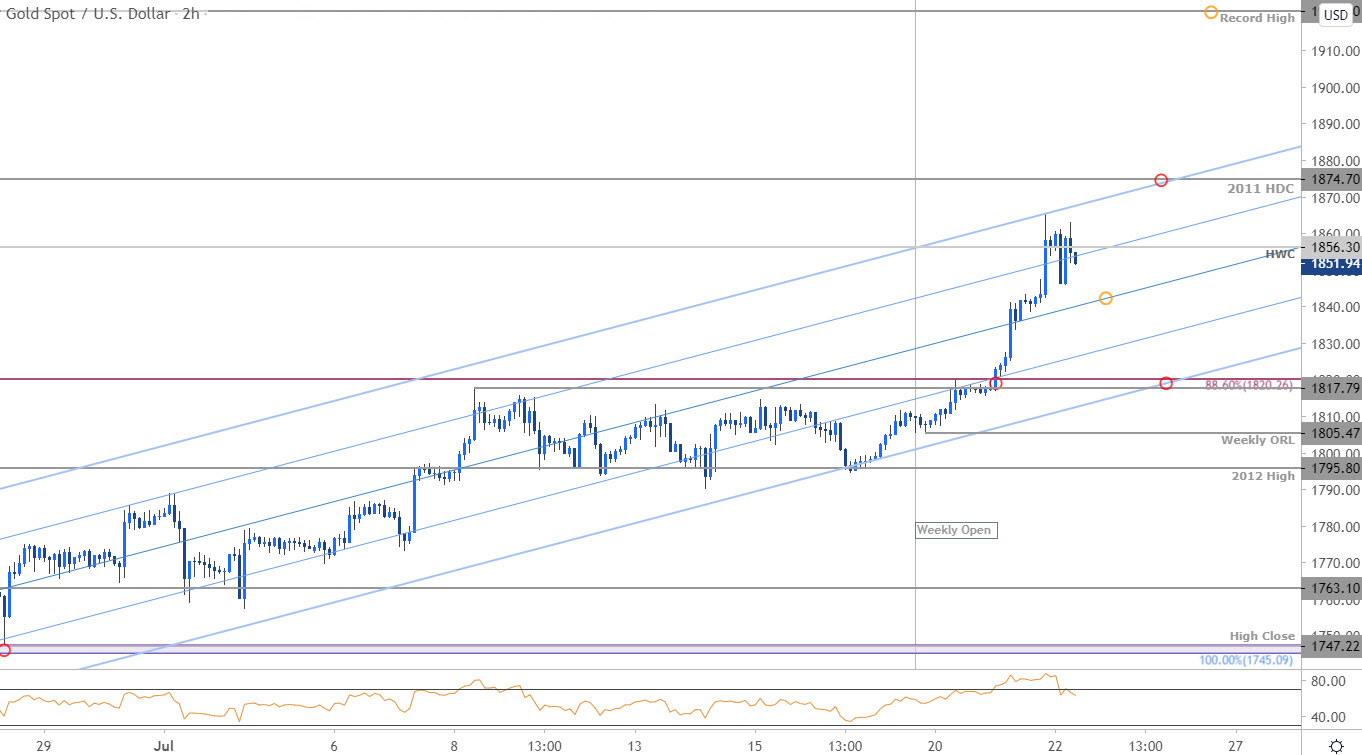
Notes: A closer look at Gold price action sees XAU/USD continuing to trade within the confines of an ascending pitchfork formation extending off the June lows with the rally testing resistance at the upper parallel in Asia trade last night. Risk for topside exhaustion into this zone but the advance remains constructive while above the median-line (currently ~1840s) with a breach / close above 1874 needed to fuel the next leg higher in price. Key near-term support rests at 1817/20 with a break below the weekly open at 1805 needed to suggest a larger-scale correction is underway.

Bottom line: The gold price has extended into a zone that could interrupt the immediate advance at uptrend resistance– that said the focus is higher while above the median-line. From at trading standpoint, look to reduce long-exposure / raise protective stops on a test of 1874- look for a larger reaction there IF reached. Ultimately a pullback off this slope may offer more favorable opportunities closer to uptrend support with a breach of this formation exposing the record highs. Review my latest Gold Weekly Price Outlook for a closer look at the longer-term XAU/USD technical trading levels.
For a complete breakdown of Michael’s trading strategy, review his Foundations of Technical Analysis series on Building a Trading Strategy
Gold Trader Sentiment – XAU/USD Price Chart

- A summary of IG Client Sentiment shows traders are net-long Gold- the ratio stands at +2.09 (67.60% of traders are long) – bearishreading
- Long positions are5.89% lower than yesterday and 0.60% higher from last week
- Short positions are 8.97% lower than yesterday and 5.34% lower from last week
- We typically take a contrarian view to crowd sentiment, and the fact traders are net-long suggests Gold prices may fall. Traders are further net-long than yesterday and last week, and the combination of current positioning and recent changes gives us a stronger Gold-bearish contrarian trading bias from a sentiment standpoint.
| Change in | Longs | Shorts | OI |
| Daily | -1% | -4% | -2% |
| Weekly | -1% | -9% | -5% |
---
Active Trade Setups
- Australian Dollar Forecast: AUD/USD Breakout Rallies to New 2020 High
- Dollar vs Mexican Peso Price Outlook: USD/MXN Range Contraction
- Canadian Dollar Price Outlook: USD/CAD Returns to Range Support
- Japanese Yen Price Outlook: USD/JPY Recovery at Risk into Resistance
- S&P 500 Technical Analysis: Stock Rally Vulnerable- Breakout Levels
- Written by Michael Boutros, Technical Strategist with DailyFX
Follow Michael on Twitter @MBForex


