


XAU/USD Technical Outlook
Gold Price- Edges Higher
On Friday, bulls gained more ground and pushed the price to an over two-week high at $1,745. As a result, the weekly candlestick closed in the green with a 0.7% gain.
The Gold price recovered last week’s losses then pointed higher amid growing concerns that rising coronavirus cases in the US and the newly reported cases in China may slow down or pause the world economic rebound.
Gold DAILY PRICE CHART (DEC 1, 2019 – June 22, 2020) Zoomed out


Gold DAILY PRICE CHART (April 5 – June 22, 2020) Zoomed In
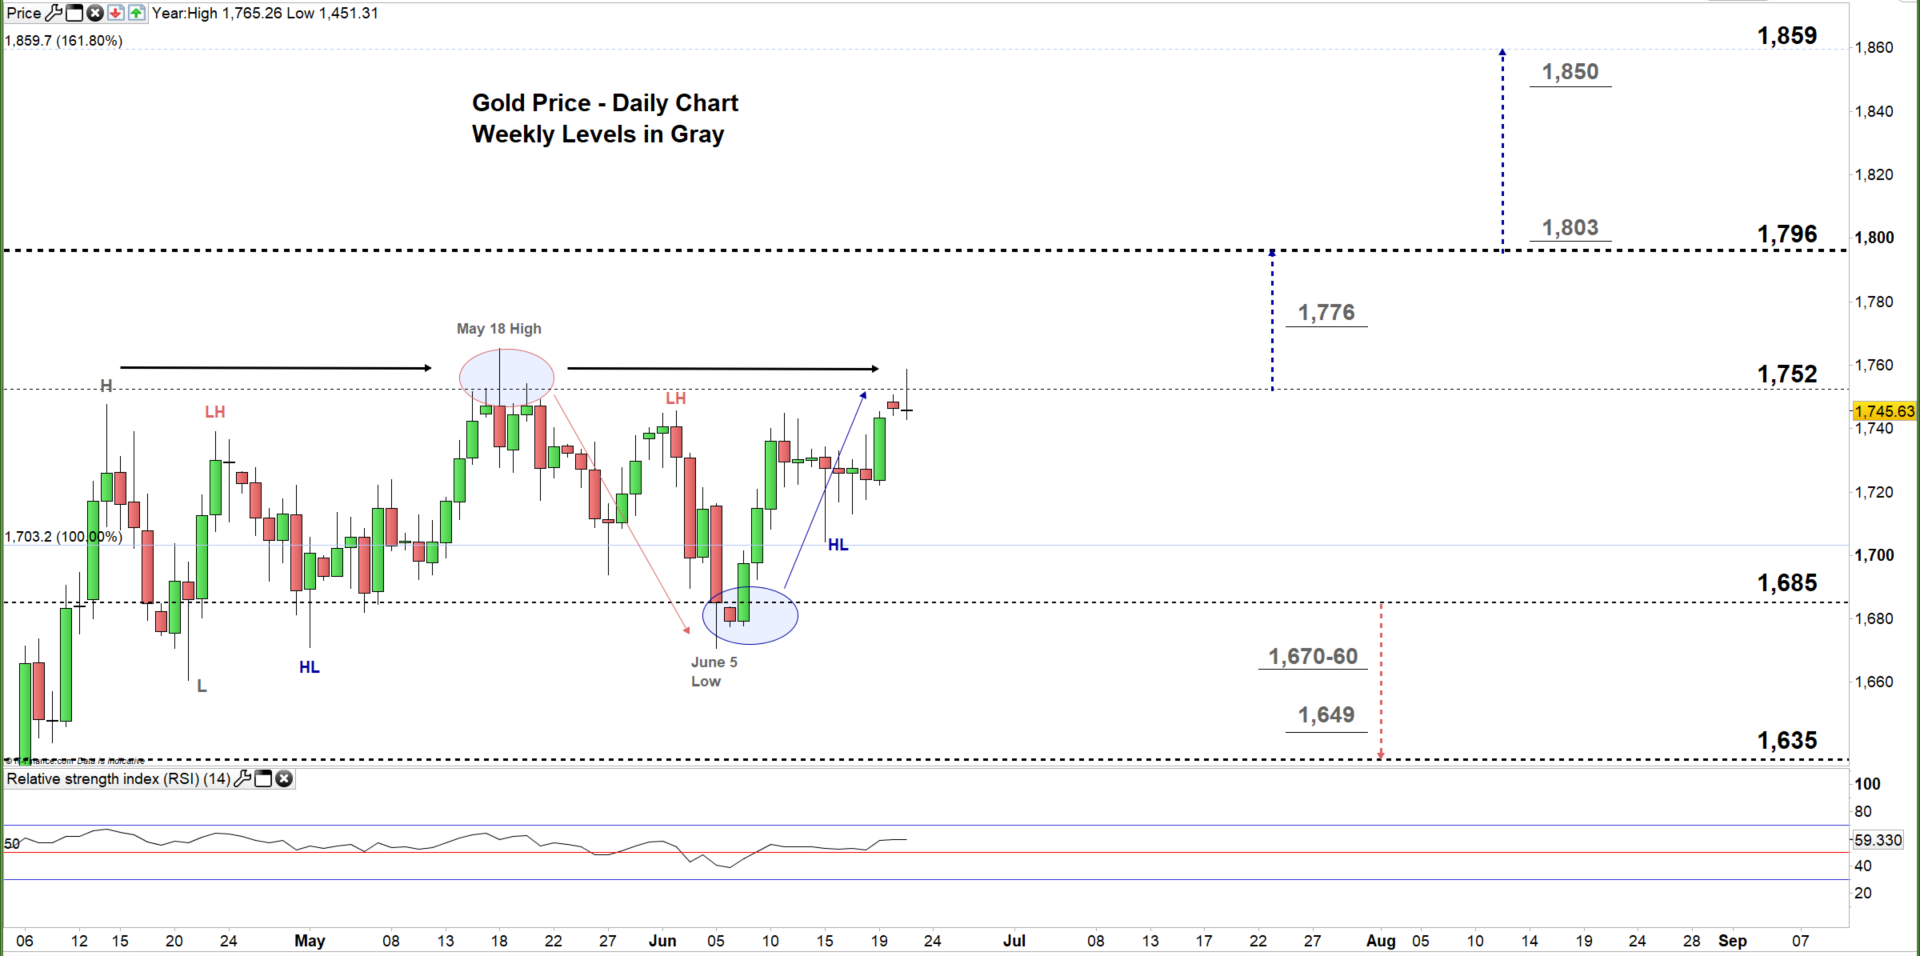
On June 8, the precious metal climbed to the current trading zone $1,685 - $1,752 and maintained its sideways move highlighting weak bulls and weaker bears. Today, the price has broken above the high end of the aforementioned zone and rallied to a five-week high at $1,758.
A close above the high end of the zone indicates that bulls are gaining momentum and this could trigger a rally towards $1,796. Any further close above this level means a stronger bullish sentiment and may extend the rally towards $1,859.
In turn, a close below the high end of the zone may lead Gold to repeat the mid-May scenario ie, the price could continue its sideways move and press towards the low end of the zone. Any close below this level indicates that bulls are losing momentum and may send XAU/USD even lower towards $1,635.

Gold Four-HOUR PRICE CHART (May 15 – June 22, 2020)
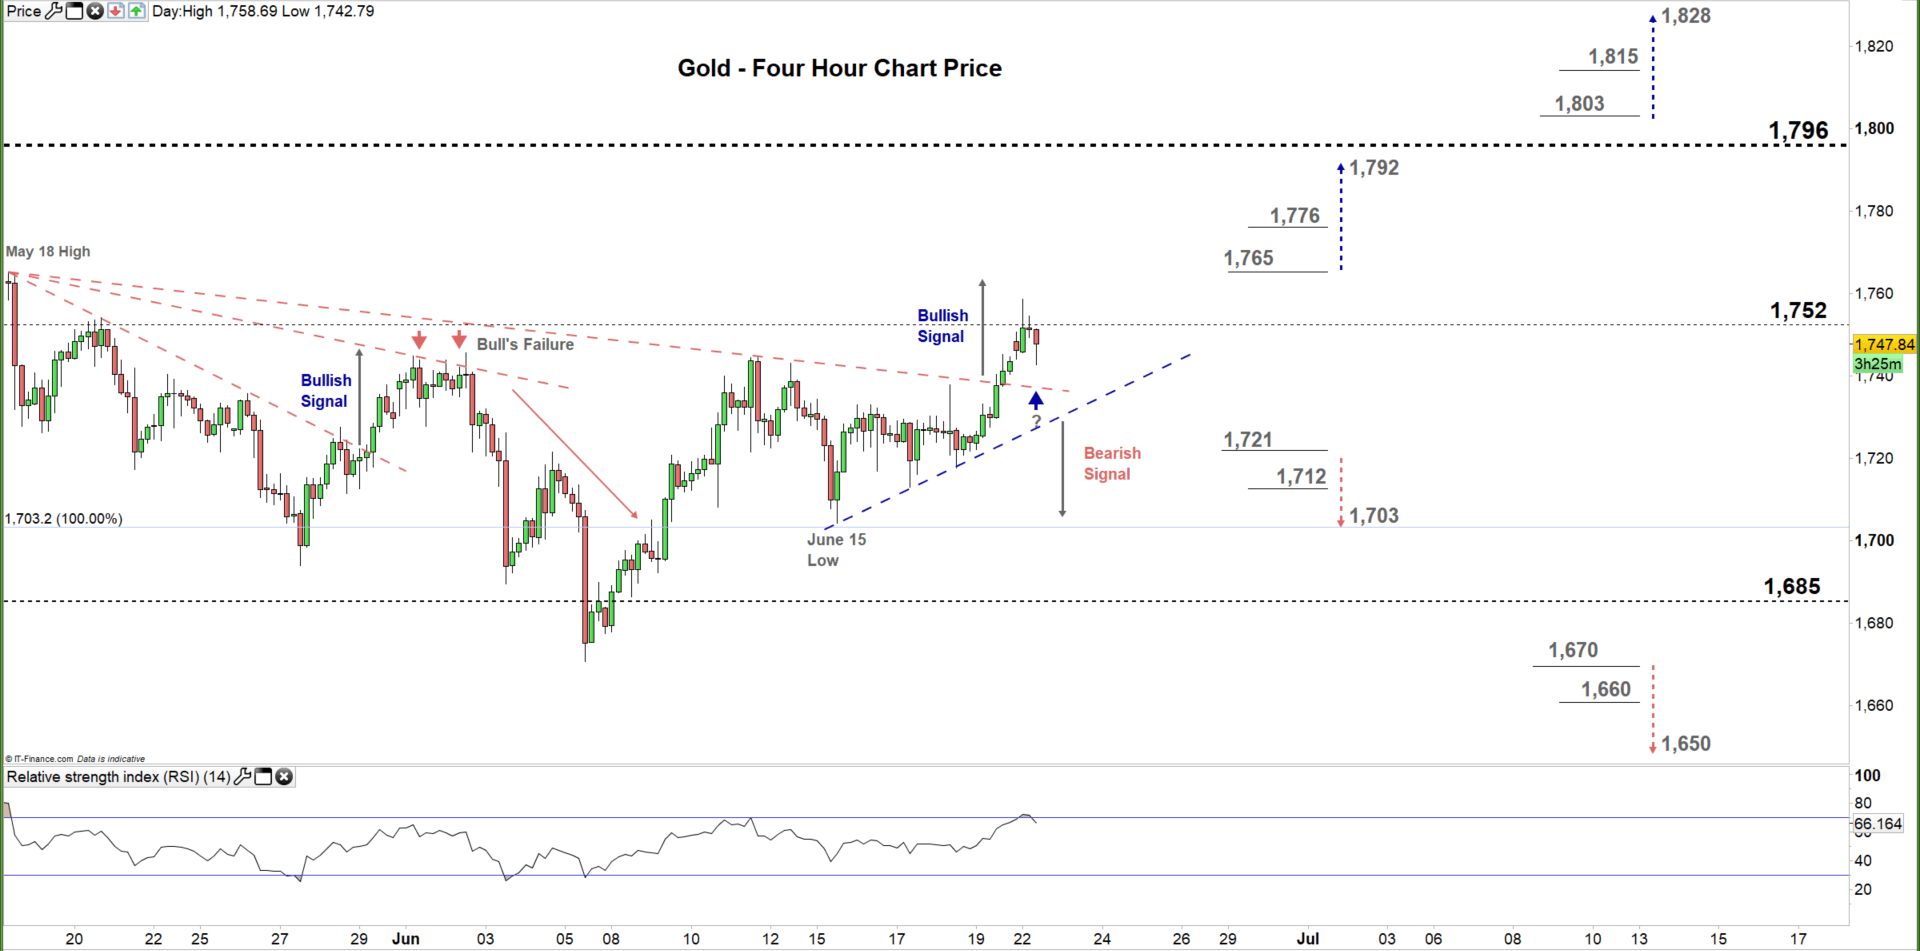
On Friday, XAU/USD rallied above the higher trend line on the downtrend lines fan originated from the May 18 high at $1,765 and generated a bullish signal. That said, any violation of the uptrend line originated from the June 15 low at $1,704 would be considered a bearish signal.
Thus, a break above the aforementioned May 18 high may cause a rally towards $1,792 on the other hand, any break below $1,721could send Gold towards $1,703. Nonetheless, the daily resistance and support levels marked on the four-hour chart should be watched closely.

Written By: Mahmoud Alkudsi, Market Analyst
Please feel free to contact me on Twitter: @Malkudsi


