


Gold Technical Price Outlook: XAU/USD Near-term Trade Levels
- Gold price updated technical trade levels – Daily & Intraday Charts
- XAU/USD recovery approaching near-term downtrend resistance at monthly open
- New to Gold Trading? Get started with this Free How to Trade Gold -Beginners Guide
Gold prices rallied more than 3.2% off last week’s low with the advance now approaching near-term downtrend resistance- we’re looking for a reaction just higher for guidance. These are the updated targets and invalidation levels that matter on the XAU/USD technical charts in the days ahead. Review my latest Weekly Strategy Webinar for an in-depth breakdown of this gold trade setup and more.
Gold Price Chart - XAU/USD Daily
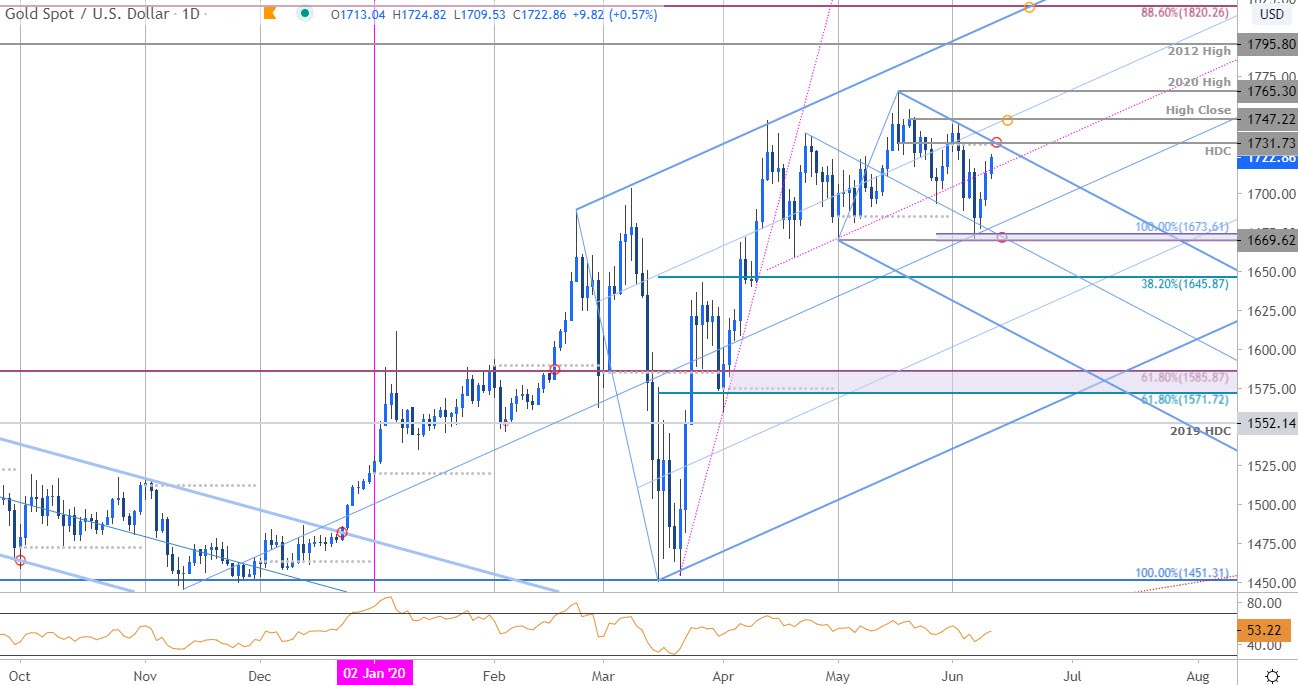
Chart Prepared by Michael Boutros, Technical Strategist; Gold on Tradingview
Technical Outlook: In my last Gold Price Outlook we noted that XAU/USD was,“approaching uptrend support and we’re looking for a reaction.” Price rebounded off key near-term support last week at the May low / 100% Fibonacci extension of the mid-May decline at 1669/73 (low registered at 1670) with the advance now eyeing confluence resistance at 1731- a level defined by the a objective June open and the yearly high-day close. Ultimately, a breach / close above the yearly high-close at 1747 would be needed to mark resumption of the broader uptrend.
Gold Price Chart - XAU/USD 120min
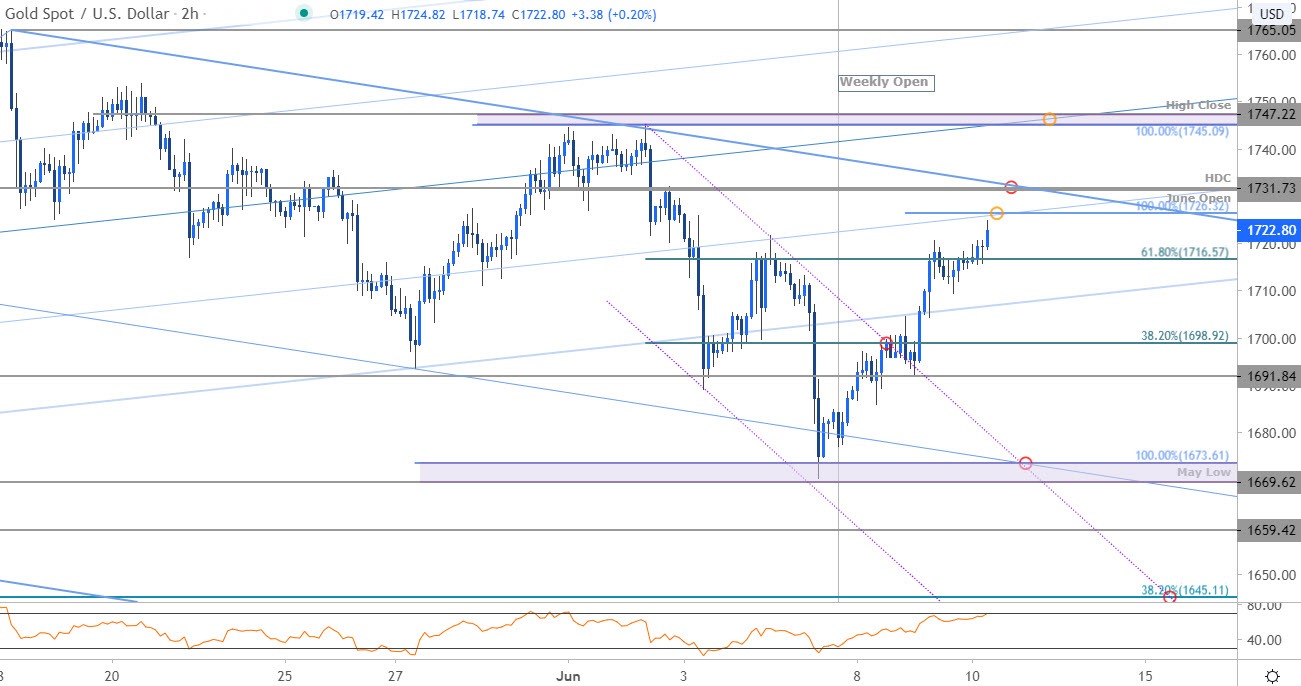
Notes: A closer look at Gold price action sees XAU/USD trading within the confines of a descending pitchfork formation with recent recovery now approaching initial resistance at 1726 backed by 1731- both regions of interest for possible topside exhaustion IF reached. Initial support now back at 1700 backed by 1691. A break / close below 1669/73 is needed to suggest a larger correction is underway towards 1645.

Bottom line: The gold rebound is now approaching near-term downtrend resistance at the objective monthly open. From a trading standpoint, look for reduce long-exposure / raise protective stops on a stretch into the upper parallel – look for a reaction there for guidance. Rallies should be capped by the upper parallel IF price is indeed heading lower. Review my latest Gold Weekly Price Outlook for a closer look at the longer-term XAU/USD technical trading levels.
For a complete breakdown of Michael’s trading strategy, review his Foundations of Technical Analysis series on Building a Trading Strategy
Gold Trader Sentiment – XAU/USD Price Chart
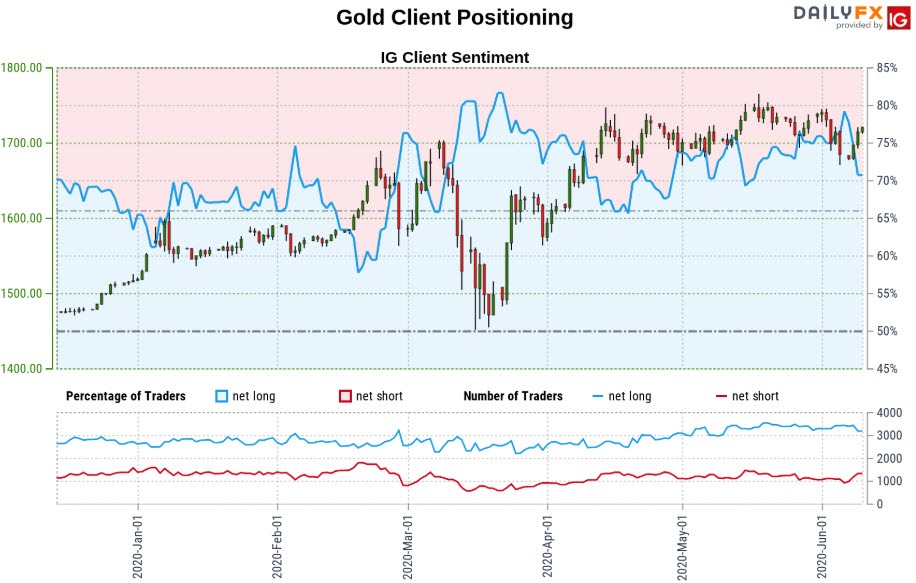
- A summary of IG Client Sentiment shows traders are net-long Gold- the ratio stands at +2.52 (71.56% of traders are long) – bearishreading
- Long positions are5.59% lower than yesterday and 3.74% higher from last week
- Short positions are 13.37% higher than yesterday and 7.74% higher from last week
- We typically take a contrarian view to crowd sentiment, and the fact traders are net-long suggests Gold prices may continue to fall. Yet traders are less net-long than yesterday and compared with last week. Recent changes in sentiment warn that the current Gold price trend may soon reverse higher despite the fact traders remain net-long
| Change in | Longs | Shorts | OI |
| Daily | -2% | -2% | -2% |
| Weekly | 3% | 16% | 10% |
---
Active Trade Setups
- Australian Dollar Price Outlook: Aussie Breakout Stalls at 2020 Open
- Dollar Price Outlook: USD Technical Breakdown at Yearly Open Support
- Yen Technical Price Outlook: USD/JPY Breakout Testing Trend Extremes
- Dollar vs Mexican Peso Technical Outlook: USD/MXN Breakdown Levels
- Canadian Dollar Technical Outlook: Loonie Rally Slams USD/CAD into Support
- Written by Michael Boutros, Technical Strategist with DailyFX
Follow Michael on Twitter @MBForex


