


Gold Price Forecast Overview:
- Gold prices have proven resilient over the past two months, sustaining their gains back to their highest levels since 2013 despite a stronger US Dollar and surging US equity markets.
- Gold volatility continues to fall, but in context of recent price action, that may bode well for gold prices longer-term.
- According to the IG Client Sentiment Index, gold prices may not breakout higher just yet.

Gold Prices Rise amid Weaker US Dollar, Falling US Yields
The turn in risk appetite over the past few months has been astounding, with the most intense moves coming in the past weeks. A plummeting US Dollar (via the DXY Index) has breathed life into commodities, particularly precious metals, offsetting what would otherwise be a contentious backdrop given the surge higher by US equity markets. It is a remarkable sight that gold prices are less than -3% removed from their yearly highs while US equity markets are around 50% higher than their yearly lows.
Gold Volatility Continues to Drop, However
Gold prices have a relationship with volatility unlike other asset classes, even including precious metals like silver which have more significant economic uses. While other asset classes like bonds and stocks don’t like increased volatility – signaling greater uncertainty around cash flows, dividends, coupon payments, etc. – gold tends to benefit during periods of higher volatility.
Heightened uncertainty in financial markets due to increasing macroeconomic tensions increases the safe haven appeal of gold. But with signs that the US economy is rebounding faster than anticipated (V-shaped recovery, anyone?) and the Federal Reserve intent on keeping the liquidity spigot open for the foreseeable future, the winds of an inflationary US economic environment are starting to blow through financial markets.
And so, if that means gold volatility is biased to the downside, it may also mean that the traditional relationship between gold prices and gold volatility may be derailed in the short-term.
Read more: How Do Politics and Central Banks Impact FX Markets?
GVZ (Gold Volatility) Technical Analysis: Daily Price Chart (October 2008 to June 2020) (Chart 1)
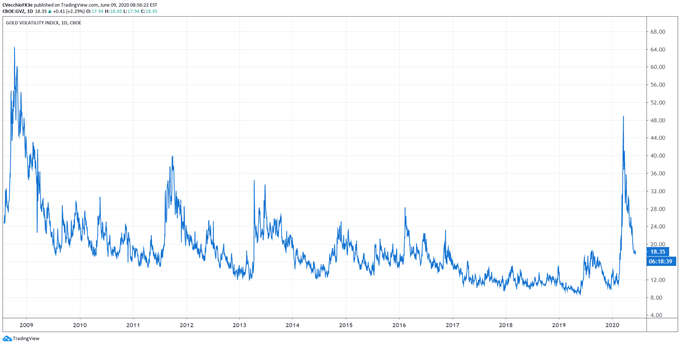
Gold volatility (as measured by the Cboe’s gold volatility ETF, GVZ, which tracks the 1-month implied volatility of gold as derived from the GLD option chain) is trading at 18.35, less than 25% of the absolute high set in mid-March near 85.50. We still maintain the belief that, given the current environment, falling gold volatility is no longer a negative for gold prices, whereas rising gold volatility is still proving bullish.
As such, the 5-day correlation between GVZ and gold prices is -0.08 while the 20-day correlation is -0.79; one week ago, on June 2, the 5-day correlation was -0.85 and the 20-day correlation was -0.87; and one month ago, on May 12, the 5-day correlation was -0.11 and the 20-day correlation was -0.29. The sustained erosion of the 20-day correlation highlights the fact that the traditional positive relationship between gold prices and gold volatility is currently on pause.
Gold Price Technical Analysis: Daily Chart (June 2019 to June 2020) (Chart 2)
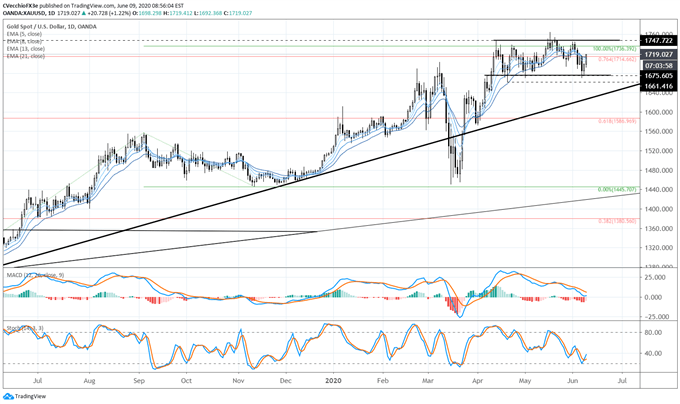
On May 18, gold prices were able to climb to a fresh yearly high, following through on the prior Friday’s breakout from the sideways range carved out between the April 14/2020 high at 1747.72 and the April 21 swing low at 1661.42. This was expected, as we noted ahead of the breakout that “given that gold prices rallied into this consolidation, the market retains an upside bias.”
The prognosis of gold price action as a bullish symmetrical triangle has evolved into that of a sideways consolidation; contextually, having rallied into this consolidation, gold prices would still retain an upside bias. The measured move, derived from the high/low range between 1675 and 1748, calls for a move towards 1821 should resistance break.
Failure to achieve a topside breakout through 1748, and instead produce failure below 1675, would give gold price action the hallmark of a topping pattern, insofar as the measured move lower would be targeting 1602.
Gold Price Technical Analysis: Weekly Chart – Inverse Head and Shoulders Pattern (June 2011 to June 2020) (Chart 3)
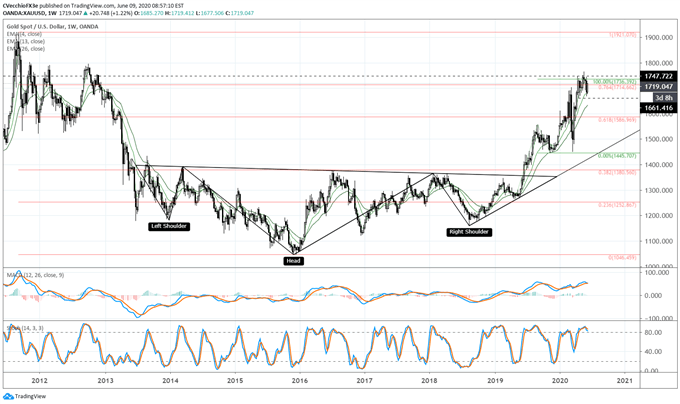
Gold prices have made significant progress within the confines of the multi-year inverse head & shoulders pattern, achieving their highest level since November 2012 earlier this week. It thus still holds that the rally into and through the 76.4% retracement (1714.66) must be viewed in context of the longer-term technical picture: the gold price inverse head and shoulders pattern that was triggered in mid-2019 is still valid and guiding gold price action.
Depending upon the placement of the neckline, the final upside targets in a potential long-term gold price rally, if drawing the neckline breakout against the August 2013 high at 1433.61, calls for a final target at 1820.99. This dovetails neatly with the measured move on the daily timeframe looking for gold prices to rally into 1834.02.
IG Client Sentiment Index: Gold Price Forecast (June 9, 2020) (Chart 4)
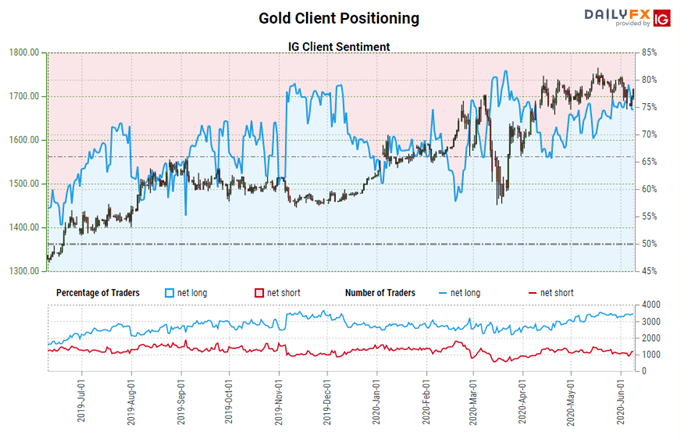
Gold: Retail trader data shows 75.13% of traders are net-long with the ratio of traders long to short at 3.02 to 1. The number of traders net-long is 0.70% lower than yesterday and 4.32% higher from last week, while the number of traders net-short is 1.44% lower than yesterday and 4.34% lower from last week.
We typically take a contrarian view to crowd sentiment, and the fact traders are net-long suggests Gold prices may continue to fall.
Traders are further net-long than yesterday and last week, and the combination of current sentiment and recent changes gives us a stronger Gold-bearish contrarian trading bias.

--- Written by Christopher Vecchio, CFA, Senior Currency Strategist


