


Gold Price Technical Highlights:
- Gold setting up near-term to rally again soon
- Levels created post-2011 spike-high are eyed near 1800
Gold setting up near-term to rally again soon
The long-term trend in gold price since 2018 has mostly been up with only the March move really shaking the tree to a serious extent. The recent trend off the March low has developed with a fair amount of structural soundness, which underpins the notion of higher prices still.
At the moment gold is undergoing what appears to be a consolidation phase versus the development of a top. This of course could be the wrong outlook but there are signposts to watch to help validate or invalidate this bias.
The key for longs is that the reversal-day low at 1658 created on April 21 is held, at a minimum. A close below that point could usher in a meaningful pullback. Stay above and a horizontal digestion phase can develop further.
But it appears that gold may be putting in higher low from that point via Tuesday’s low at 1692, which is even better than a horizontal correction. If this the case then a wedge indeed may be developing that could given gold more power to push on to new heights. An eventual break through 1747 will be needed to get this scenario in full-play.
Even with a generally bullish bias it may not be long though before gold is put to the test at a major resistance zone from around 1770 up to 1803. This zone was created via three peaks from November 2011 to October 2012 that formed in the wake of the September 2011 bull market blow-off.
This resistance zone is not to be taken lightly given its significance as part of the topping process that led to a multi-year bear market. The bottom of the same topping process around 1540 was a point of focus for us in August. That led to an intermediate-term congestion phase. A similar outcome or worse could happen on a further run from here.
But should gold bust on through aforementioned zone then we will have to start talking about the bull market high at 1921, a level that at some point looks likely to be exceeded, but could take some time to achieve. In any event, the short-term picture appears to be shaping up for at least a test of the 2011/12, perhaps better. But only if 1658 doesn’t buckle.

Gold Price Daily Chart (setting up well so far)
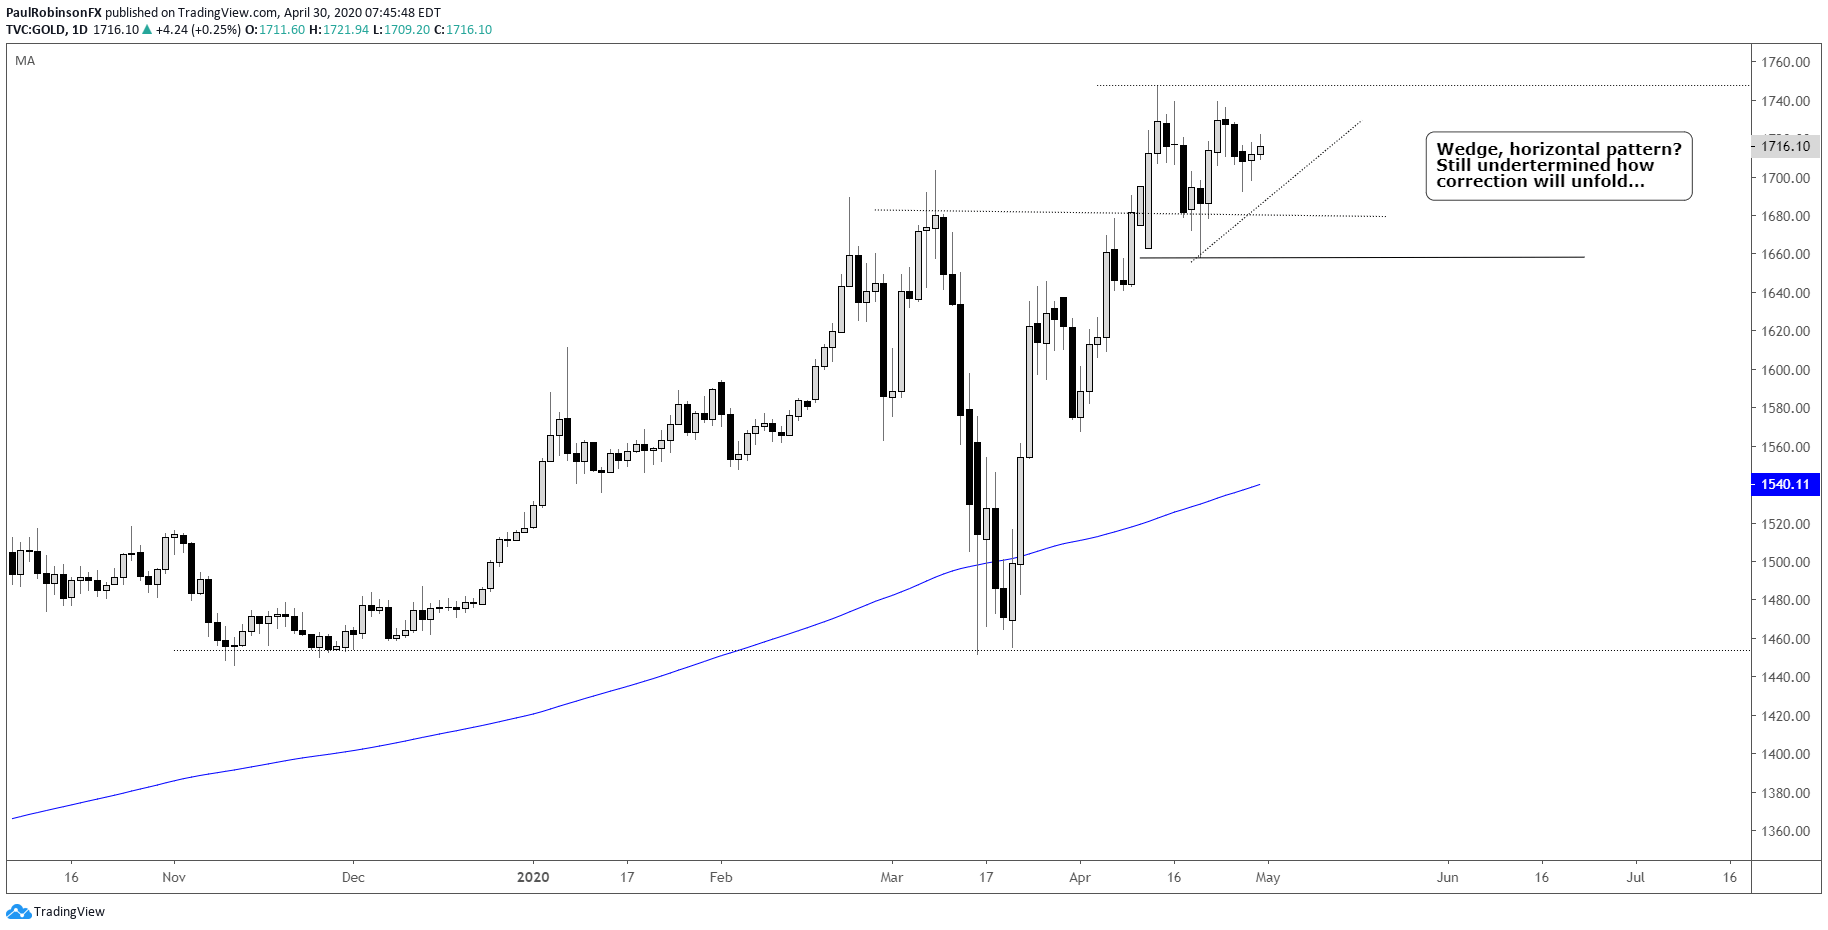
Gold Price Chart by TradingView
Gold Price Weekly Chart (big levels ahead from 2011/12)

Gold Price Chart by TradingView
Resources for Forex Traders
Whether you are a new or experienced trader, we have several resources available to help you; indicator for tracking trader sentiment, quarterly trading forecasts, analytical and educational webinars held daily, trading guides to help you improve trading performance, and one specifically for those who are new to forex.
---Written by Paul Robinson, Market Analyst
You can follow Paul on Twitter at @PaulRobinsonFX


